Small falls overnight in the U.S. Energy down. Gold up. Oz market up this morning.
Dow Jones -0.16%. SP500 -0.2%. Nasdaq -0.07%. Small Caps -0.32%. Banks -0.55%.
SP500
Another “doji” candlestick. That’s four in a row. The more dojis – the more likely the index will fall.
Indicators have all turned down, volume is beginning to pick up, but nothing decisive so far.
Commodities.
Commodities Index -0.67%. Energy -0.8%. Base Metals -0.69%. Agriculture -0.69%. Gold +0.67%.
After 30 minutes of trading the ASX is up strongly, XJO +0.77%. That’s a surprise with the weakness in American indices and in Commodities. The only negative Sector is Energy (XEJ) -0.07%. The Ozzie market must be expecting benign CPI numbers tomorrow.
The ASX performed well this week with the XJO rising +1.04%. That performance pales somewhat when compared to the broad market index in America, SP500, up +2.24%.
Large Cap stocks (100 Leaders) above key Moving Averages
Conclusion.
STW Chart (ETF for XJO).
The short-term trend remains up – indicated by three yellow supertrend lines. (Three yellow = up trend, mixed colours = possible trend change, three blue = down trend.)
This week, XJO broke above the restraining influence of the 50-Day MA, but remains below the 200-Day MA. Any rally which occurs without breaking above the 200-Day MA remains, in my view, a counter-trend rally which is likely to revert to the down-side.
Volume studies (Volume and Force Index) indicate a slackening in investor enthusiasm for further upside. Both those indicators are sloping downwards while the STW chart continues to the upside.
So, STW has broken above its 50-Day MA but on decreasing volume. That suggests, unless we see an increase in volume, the chart will pull to the downside.
ASX Sector Performance this week.
The best performing sectors this week were all up >3%. Information Technology (XIJ) +3.92%. Property (XPJ) +3.89%. Materials (XMJ) +3.11%. Three sectors were flat. Discretionary (XDJ) +0.09%. Staples +0.07%. Utilities -0.05%.
Weak sectors were Energy (XEJ) -1.88%, Telecommunication Services (XTJ) -1.33% and Financials (XXJ) -0.53%. XXJ was hit by two big banks going ex-dividend. ANZ on Thursday fell -3.28% and NAB on Tuesday fell -3.22%.
Other sectors performing well were Health (XHJ) 1.66% and Industrials (XNJ) +1.37%.
ASX Sector Performances in November.
So far in November, the broad market Index, XJO, is up 3.96%.
Outperformers were: Property (XPJ) +11.77%. Health (XHJ) +9.91%. Information Technology -6.88%. Industrials +6.48%. Discretionary +5%. Materials +4.7%.
(XPJ has been the beneficiary of a perception that interest rate hikes are coming to an end, and the possibility of interest rate cuts. The stock market is forward looking and XPJ seems to be predicting interest rate cuts.)
On the negative side: Energy (XEJ) -7%. Utilities (XUJ) -2.97%. Staples (XSJ) was flat, down just -0.1%
Under-performers but still positive: Financials (XXJ) +2.27% and Tele Communications (XTJ) +3.09%.
Energy (XEJ) has been in a down trend since mid-October.
Momentum indicators are showing positive divergences. Downside momentum is slowing, so this down-trend may be coming to an end.
New Highs minus New Lows Cumulative provides a reasonably reliable guide for medium to long-term investors. When the H-L Cum rises above its 10-Day MA it provides a “buy” signal.
H-L Cumulative has been in a down-trend since early September and is just now reaching up to its 10-Day MA. A definite x-0ver would provide a “buy” signal for medium to long-term investors.
Note that the current up-trend in the XJO (STW) has not been confirmed by a change in direction of the H-L Cum chart. H-L Cum can sometimes be a lagging indicator, but this current lack of confirmation again throws doubt on the current up-trend in the XJO.
Large Cap stocks (100 Leaders) above key Moving Averages
% of Large Cap stocks above 200-Day MA. Last week 39%. This week 39%.
% of Large Cap stocks above 50-Day MA. Last week 47%. This week 57%.
% of Large Cap stocks above 10-Day MA. Last week 69%. This week 57%.
The short term (above 10DMA) and medium term (above 50DMA) remain bullish, i.e., above 50% but momentum has slowed.
Long-term (above 200-Day MA) remains below the bullish level of 50%. That confirms the effects noted above. The ASX is in a counter-trend rally but needs further improvement to prove that it is in a bull-market.
Conclusion.
The month of November has been good for the XJO with solid performances by most sectors. Property and Health have been the big winners.
Momentum, however, is slowing – such an effect usually precedes a move to the downside. Volume studies suggest a weakening in the enthusiasm by investors for the current rally.
The Australian market took its lead from a strong U.S. market last night and XJO finished up +1.42%.
Here’s the chart for STW – ETF for the XJO
STW had a big gap up on opening and then, more or less, slid sideways for the rest of the session.
It looks destined now to test the 200-Day MA as resistance.
European stocks are up in early trading after a big rise last night. STOXX600 currently up +0.69%.
Dow Futures are up modestly +0.19%.
Ten out of eleven sectors on the Australian market were up today. The only negative sector was Energy -0.72%. The three best sectors were Property +4.58%, IT +3.35% and Materials +2.42%.
Last night in the U.S. Jobs Report was released and the employment situation worsened – that increases the likelihood of a rate cut – which is good for stocks.
Dow Jones +1.18%. SP500 +1.26%. Nasdaq +1.99%. Small Caps +0.78%. Banks +0.83%.
SP500
Last night’s Jobs Report introduced a lot of optimism in traders and the market opend with a big gap up – but that was about it for the day. Not much happened after the opening.
The dojo candle finished right at the dynamic resistance level of the 50-Day MA. That’s a hurdle it has to overcome.
In the past are two levels of congestion – supply/demand zones – which the market also has to navigate. The most recent one occcurring at the beginning of April is a supply zone – thats where supply overcame demand and the market fell. If supply remains at that level then the market will fall again.
Most of the indicators are back into bullish zones, but the Detrended Price Oscillator (DPO) is the out-lier. It remains in its bearish zone.
The next couple of days trading will see a decision made by the market about whether it is bearish or bullish. It’s had a good rally off the low of 19 April. It’s risen +3.75% since then. Expect a pause before a push into bullish territory – above the supply zone – or a resumption of the down trend.
Commodities.
Commodities Index flat +0.13%. Energy -0.44%. Base Metals +0.74%. Agriculture +2.22%. Gold flat -0.08%.
Energy might be developing a base after a big ABC downside movement. Look for a big bullish candle to indicate that the pull-back is over.
Yesterday in Australia
XJO had a positive day, +0.55%, but it is nowhere near as positive as the American market.
It finished Friday at the 12-Day MA and well below the dynamic resistance level of the 50-Day MA where supply has come into the market previously.
Our market will surely follow the U.S. up on Monday but I doubt it can make it up to the 50-Day MA. That looks like a bridge too far.
BHP was up last night in the U.S., +0.82%, but that’s not a big increase given the performance of the U.S. market on Friday. BHP in the U.S. remains well below its 50-Day MA which has been an important support/resistance level for the stock since late March. It needs to get above that to provide optimism of a bullish upside movement.
BHP finished last night at 56.40 – with major horizontal support at 55.20. 50-Day MA currently at 57.41.
Dow Jones +0.85%. SP500 +0.91%. Nasdaq +1.51%. Small Caps +1.5%. Banks +0.52%.
Apple is up about 6% in after market trading which will flow on to Tech stocks.
Jobs Report tonight in the U.S.
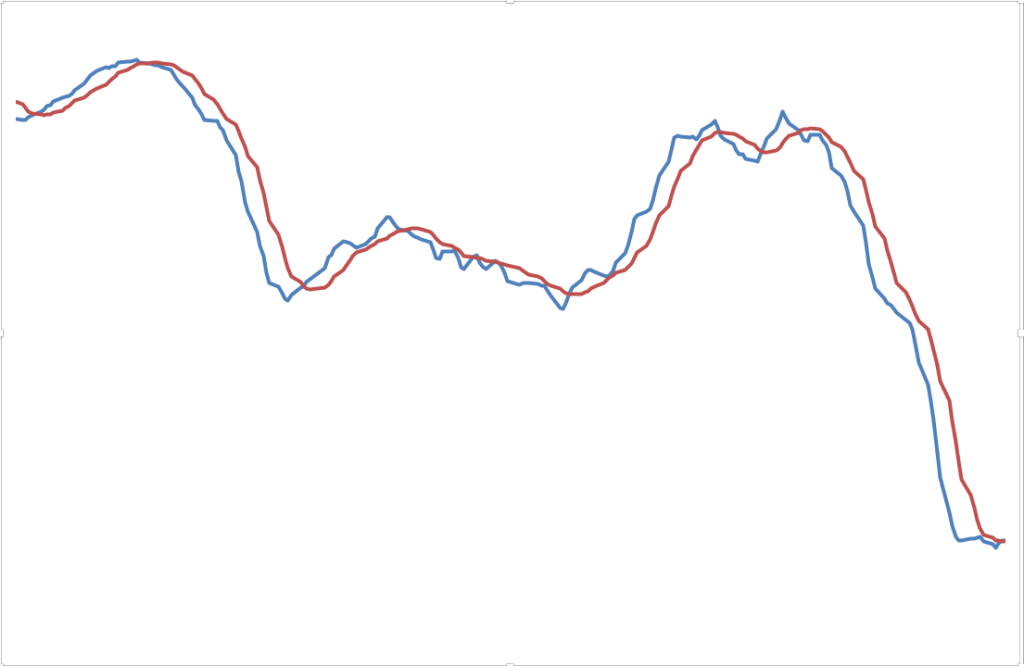
sp500
SP500 had a strong session but continues to respect the 20-Day MA which is below the 50-Day MA. That’s a bearish context. The Hull MA13 remains turned down. Indicators are bearish.
Tonight in the U.S., the Jobs Report comes out before the market opens. That is a key economic report that traders value, so it could be market changing.
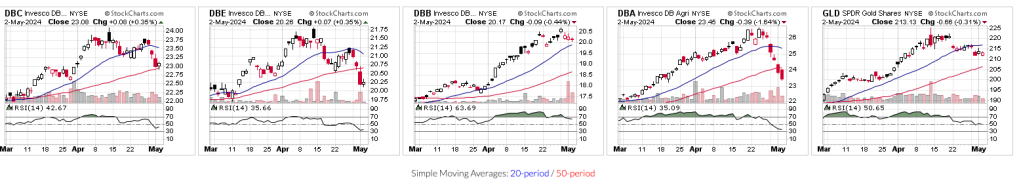
Commodities
Commodities Index up modestly, +0.35%. Energy also up +0.35%. Base Metals -0.44%. Agriculture continues to fall heavily, -1.64%. Gold down modestly -0.31%
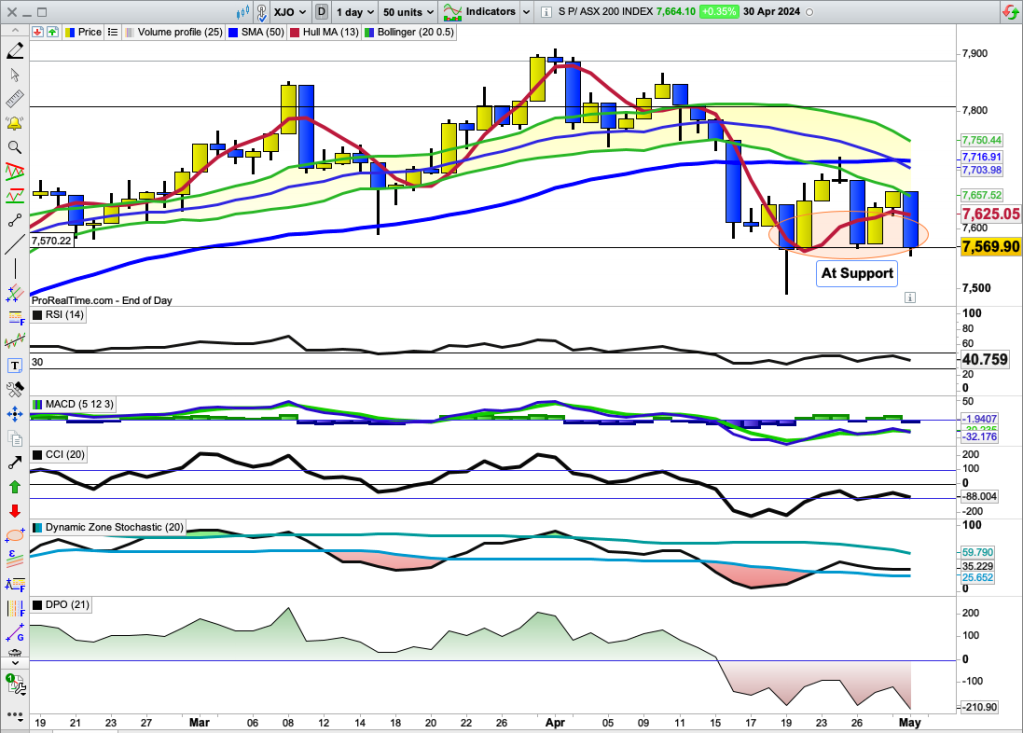
As mentioned yesterday, this is the third time that XJO has fallen heavily to horizontal support and each time has rebounded, but this time, the rebound was noticeably weaker than previous times. There was also evidence of intra-day selling today. But until support is broken we mustn’t jump to conclusions.
Indicators remain in their bearish zones. The most likely direction is to the downside, but we need to see confirmation.
Company reports were affecting the market today, plusses and minuses.
NAB reported and the market reacted favourably, NAB up +1.45 and broke up above both its 20-Day and 50-Day MAs. That’s a bullish development.
Woolworths went the other way. Down -4.15% and a new 52-Week low.
Financials benefitted from the NAB result. Financials the second best Sector today, up +0.72%.
Staples fell under the weight of Woolworths. XSJ was the worst performer today, down -2.46%.
In early overseas trading, Euro STOXX600 is down a little -0.14%.
Dow Futures are up +0.33%. Nasdaq Futures up strongly +0.8%.
Dow Jones +0.23%. SP500 -0.34%. Nasdaq -0.33%. Small Caps +0.35%. Banks +0.67%.
Indices rose and then fell about 1% after the Fed. announcement on rates.
SP500
The long upper tail on the latest candle shows how far up, then down, SP500 went after the Fed. announcment on interest rates. (Rates were held steady.)
The index hit the 20-Day MA on the way up, said No, and fell. All the indicators are in bearish territroy.
The shortest MA (Hull MA13) has turned down after the short-term rally – that’s a new shortp-term sell signal.
The medium term trend remains down (20-Day MA). Stay with the trend.
Commodities.
Commodities Index -1.46%. Energy -2.56%. Base Metals -0.25%. Agriculture -3.25%. Gold +0.91%.
Overnight in the U.S., BHP was down -2.49%.
Sydney Futures are down -0.07% which suggests a modest fall in the ASX at the start of today’s trading.
Dow Jones -1.49%. SP500 -1.57%. Nasdaq -2.04%. Small Caps -1.9%. Banks -1.37%.
SP500
That’s a bearish candle retreating from the 50-Day MA and the 20-Day MA.
All the indicators are back in bearish territory.
Expect more downside. Sell the rallies.
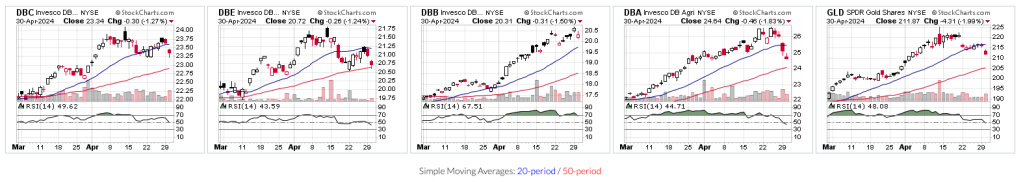
Commodities.
Commodities Index -1.27%. Energy -1.24%. Base Metals -1.5%. Agriculture -1.83%. Gold -1.99%.
Energy is back to the 50-Day MA which has served as support recently. Watch for a bounce.
After 30 minutes of trading this morning, XJO is down heavily -1.34%. Staples is the only sector in positive territory. Energy, Materials and Technology are all down >2%.
XJO was up today +0.35% after dipping into negative territory early in the session.
The chart remains well below the 50-Day MA and a death cross of the 20-Day Below the 50-Day MA is imminent.
Indicators remain below their important mid-lines or zero lines which indicate the demarcation between bullish and bearish. DPO (bottom panel) provides a clear example.
Best sectors today were Discretionary (XDJ) up +0.79% and Property (XPJ) also up +0.79%. Those are both interest rate sensitive sectors.
Compositie Bonds (IAF) was also up today +0.38% – better than the XJO which is not a great sign.
Worst sectors today were Industrials (XNJ) -0.53% and Utilities -0.12%.
Energy did relatively poorly today, XEJ up just +0.07%.
XEJ has been in a bearish down-trend since 5 April, when it topped out with a doji candle stick.
This down-trend now shows two doji candle-sticks at the bottom of the trend, which might signal a change in sentiment towards the Energy sector. Too early yet to pile in – but worth-while watching to see if we do get a turn-around.
In early trading this evening, Euro STOXX600 down -0.34%.
Dow Futures are flat -0.08%. Nasdaq Futures doing a little worse -0.19%.
The big news tonight will be the report from Amazon which could be market moving – one way or the other.
Sydney Futures is done just a little -o.09% – in line with the Dow Futures.
The Federal Reserve starts a two day meeting tonight (Oz time). The market might hold off making a big move until the Fed. announces its interest rate decision on Wed. night (Oz time).
Dow Jones +0.38%. SP500 +0.32%. Nasdaq +0.35%. Small Caps +0.66%. Banks -0.1%.
Tesla was up 15% last night which helped SP500 and Nasdaq into respectable territory. Bonds were down last night and so was Energy – both were supportive of the stock market.
It’s a big week for news this week. Amazon reports on Tuesday. Apple on Thursday. The Fed meets for a two day meeting and a Jobs Report comes out on Friday. Anything can happen this week as the market will be jerked around by announcements.
SP500.
SP500 has paused at the 50-Day MA – that’s the critical support/resistance level on the chart.
Most of my indicators are now on the bullish side of middle lines or zero lines. The only one that isn’t is CCI, just below its middle line. So the market seems to be setting up for a move to the upside.
Price is always the final arbiter. I want to see SP500 above the 50-Day MA before cheering.
Commodities.
Commodities Index flat -0.08%. Energy -0.57%. Base Metals +1.88%. Agriculture fell heavily -3.61%. Gold remains in consolidation -0.2%.
ASX fell into negative territory just after the start, down -0.05% after 15 minutes of trading.
Most Sectors are down, but Materials (XMJ) is keeping the ASX more or less on a level keel, up +0.73%.
Despite the big rise today, XJO only made up about half the fall from Friday. That’s not a big show of confidence from the market.
The chart remains below the key 50-Day MA. The 20-Day MA is within striking distance of finishing below the 50-Day MA – a death cross. RSI remains below its mid-line and CCI remains velow its zero line.
Our market remains bearish. We need to see more positive action to be sure that a bullish trend is back on the chart.
All Sectors were up today, although Energy (XEJ) only just made it into positive territory +0.01%.
Best performer today was Real Estate (XPJ) +1.69% closely followed by Technology (XIJ) +1.68%. Both of those sectors are interest-rate sensitive, so traders must sense the possibility of an RBA rate cut.
Financials (XXJ) was seventh on the Leader Board of eleven stocks. XXJ up +0.62%
Early overseas trading has seen European stocks rise, Euro STOXX600 up +0.37%.
Dow Futures up a little +0.11%. Nasdaq Futures a little better than the Dow, +0.25%.
Ozzie overnight Futures down a little -0.07%.
After such a big up day today, I’d expect the Ozzie market to pause or fall back tomorrow.
I’ve recently noted that the U.S. Indices are at a critical level. I’m expecting a fall in the U.S. tonight – which could seriously affect the Ozzie market tomorrow (if it falls).
It was a short week this week with the ASX closed on Thursday for Anzac Day.
The first three days of the week were positive – but that took the XJO up to its first hurdle. It stumbled on Friday at that level and fell back strongly after disappointing CPI figures.
It’s often scary just how well Technical Analysis works.
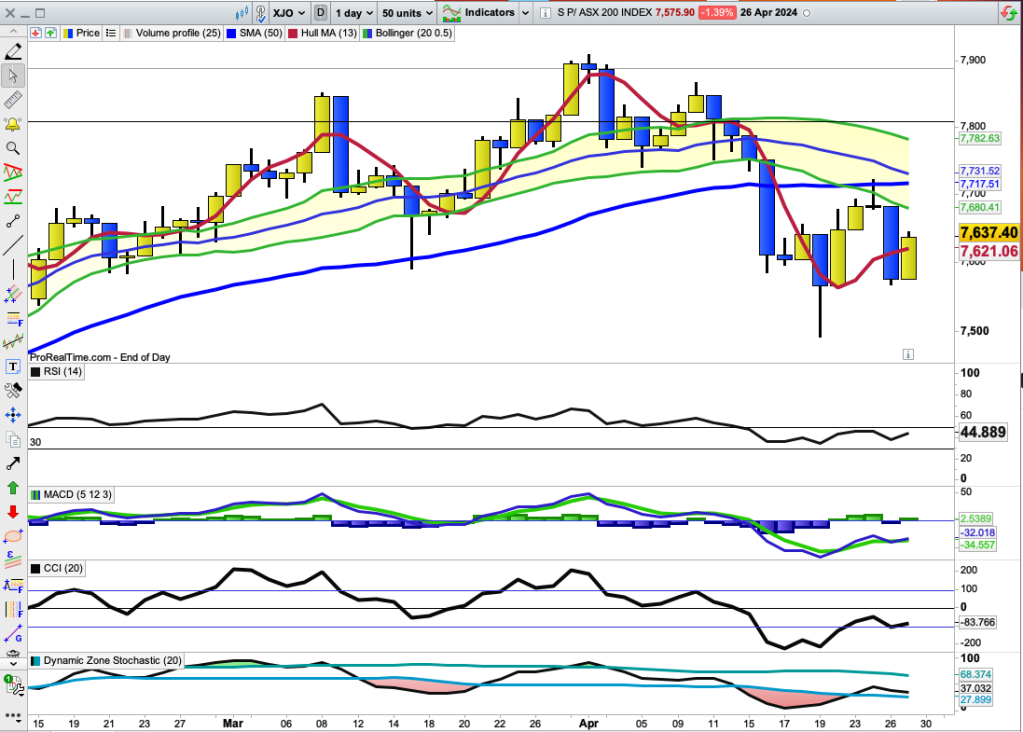
On Wednesday, the XJO hit the 50-Day MA and retreated back to its opening level, finishing flat, down just -0.01%.
That rejection at the 50-Day MA was ominous. On Friday, XJO fell heavily from Wednesday’s close. Friday was down -1.39% and most of the gains on Monday and Tuesday were erased.
XJO finished up for the week, just +0.11%. Virtually flat.
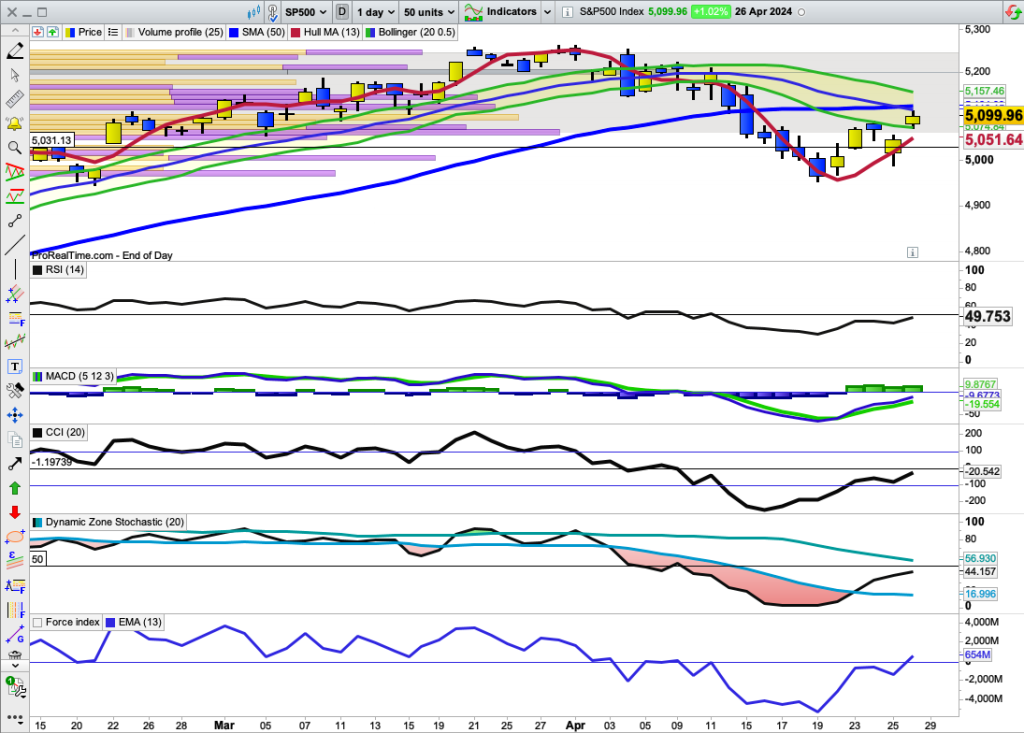
That was in stark contrast to the American market where SP500 was up +2.67% mostly on the back of surging Tech stocks such as Alphabet and IBM.
SP500
Despite the good rise this week, SP500 now faces a technical challenge similar to that of the XJO.
SP500 has risen to the confluence of the 30-Day MA and the 50-Day MA. It if fails here on Monday, then we can expect more downside.
If SP500 breaks above those two MAs, then the recent down side correction is probably over.
I have five indicators below the main chart. Four out of the five remain below their important mid-lines or zero lines, i.e., on the bearish side. Only the Force Index has managed a small break above its zero line.
A solid rise by the SP500 will take all indicators above their dividing lines between bullish and bearish.
The odds currently favour the downside.
Sector Performance – last four weeks.
The above graph shows the performance of the eleven ASX sectors + corporate bonds over the past four weeks.
This is a handy way of showing the mind-set of Investors, particularly the large investors who determine the direction of the market.
Cyclical Group, down -5.43%.
Sensitive Group, down -5.08%
Defensive Group, down -1.6%.
All groups are down, but the best relative performer is the Defensive Group -1.6%.
Until we see the Cyclical and Sensitive Groups out-performing the Defensive Group, the mind-set of Investors is definitely on the bearish side.
Stocks to follow.
Not all stocks lie in the bearish state. Some remain relatively bullish but are currently undergoing modest pull-backs. Watch these stocks to see if they bounce – which could lead to a tradable rally.
ORG
AWC
NST
Min
WHC
STO
Here’s a chart for Origin (ORG)
Until Friday, ORG had closed above the 10-Day MA (light blue line) every day since 26 March.
On Friday, ORG was down and closed below the 10-Day MA and the Hull MA13 has turned down – a very short-term sell signal. ORG has been very strong and any pull-back is likely to be bought.
The above does not imply an immediate “buy” signal – just a set of stocks to watch which might buck the bearish mood of the market.
Do your own research on these stocks – don’t take my word for it. They are offered as suggestions and as an educational posting.
Conclusion.
The ASX is currently in a bearish mood having failed comprehensively at the 50-Day MA. Over the past four weeks, the XJO has lost -4.06% and there is no sign as yet that the downside move is ready to end.
Bear Market Tactics:
If RSI14 is above 60 – assume the market is overbought and will fall.
If RSI14 is under 30 – assume the market is oversold, a bounce will probably occur and it will be a “bear trap”. (RSI is currently at 39.28).