Dow Jones +0.32%. SP500 +0.48%. Nasdaq +0.75%. Small Caps +0.7%. Banks +0.91%.
U.S. indices were all up despite Federal Reserve Chair Powell said that inflation remains a problem – so no rate cuts in sight. New CPI data comes out tonight in the U.S.
From CNBC: Federal Reserve Chair Jerome Powell reiterated Tuesday that inflation is falling more slowly than expected and will keep the central bank on hold for an extended period.
SP500
SP500 remains in a strong up trend after having seven closes above the 5-Day EMA.
5/20/50 Day EMAs are all stacked one above the other.
That says to me: buy any dip.
Commodities.
Commodities Index -0.43%. Energy -0.89%. Base Metals -0.58%. Agriculture +0.98%. Gold +0.85%.
I asked a rhetorical question in the lead. What’s not to like? The answer: Energy. That may impact the Ozzie market today.
Overnight Sydney Futures finished up +0.46%. Clearly that was influenced by the good performance in the U.S., but before that, Sydney Futures are well up after the Budget presentation by the Federal Treasurer.
Dow Jones -0.21%. SP500 -0.02%. Nasdaq +0.2%. Small Caps +0.14%. Banks -0.44%.
SP500
Commodities.
Commodities Index +0.64%. Energy +0.63%. Base Metals +1.92%. Agriculture down heavily -4.86%. Gold back down to support at the 20DMA, -1.12%. Gold is likely to rise from that support.
Iron Ore +0.32%.
Despite Iron Ore being up and Copper hitting a two-year high last night, BHP was flat overnight in the U.S. BHP +0.02%.
Here’s the chart for Copper:
Copper is in a strong up-trend. The red metal is often taken as a proxy for economic growth. It is in a strong up-trend – which suggests there’s nothing much wrong with world economics. Another indication that Central Banks won’t be in a hurry to cut interest rates any time soon?
Copper is an increasingly big part of wealth for BHP as it has been divesting itself of coal mining projects. It is also the reason behind BHP’s recent tilts at taking over the huge miner, Anglo-American. Not withstanding all of that, BHP’s stock price continues to languish.
Here’s the chart for BHP in the U.S.:
BHP has been in a sideways channel since early this year. It will find direction when it breaks one way or the other out of that channel.
Sydney Futures are down a little this morning -0.1%. That suggests a weak opening.
Dow Jones +0.85%. SP500 +0.51%. Nasdaq +0.27%. Small Caps +1.14%. Banks +0.79%.
Something doesn’t smell right about this market. Dow up seven days in a row +0.85% today, but Nasdaq going to sleep? Nasdaq up only +0.27% Nasdaq’s got all those big Tech stocks in it – the growth engine of the market.
No, something’s not right. Can’t continue to worry about that – just put it on the back burner for the time being.
(Hmm. Thought bubble – Stagflation?)
SP500
SP500 has come up to the Point of Control on the Volume Profile (just ahead).
The top of the Value zone (big grey rectangle) is close – that’s often a stopped.
RSI is at 61.23 – that’s around the area where an index stops under bearish conditions.
But – the trend is up – stay with the trend until otherwise indicated.
(I think I’ll write a book: How to stay asleep at night while the stock market wobbles.)
Commodities
Commodities Index +0.39%. Energy +0.29%. Base Metals +0.59%. Agriculture-0.12%. Gold snuck back above the 20-Day MA, +1.58%.
Iron Ore +0.32%.
With IO and Base Metals up, it should be a good day for the Miners today.
Yesterday in Australia, Consumer Discretionary led the falls in the eleven sectors. XDJ down -2.56%. Here’s the chart:
XDJ hit the 50-Day MA and fell heavily. That’s typically bear market action. It threw the three Super Trend Lines back into the blue. (Blue = bearish).
That suggests that the Reserve Bank’s interest rate policy is really starting to bite hard. That could be bringing forward thoughts of an interest rate cut.
ASX was up this week, +0.7%. Lithium stocks did especially well this week helping the market higher.. Here is a selection with rises for the week: Arcadium Lithium +19.9%, Pilbara +10%, Mineral Resources 6.94%, IGO +11.39%. Not bad – but Uranium stocks did even better, Silex Systems +24,63%, Boss Energy +21.23%. All those stocks, however, represent a small part of the market. The best performing sector this week was Real Estate (XPJ) +3.14%. If Real Estate is doing well, it usually means investors are sniffing a rate cut in the air.
Let’ not get ahead of ourselves.
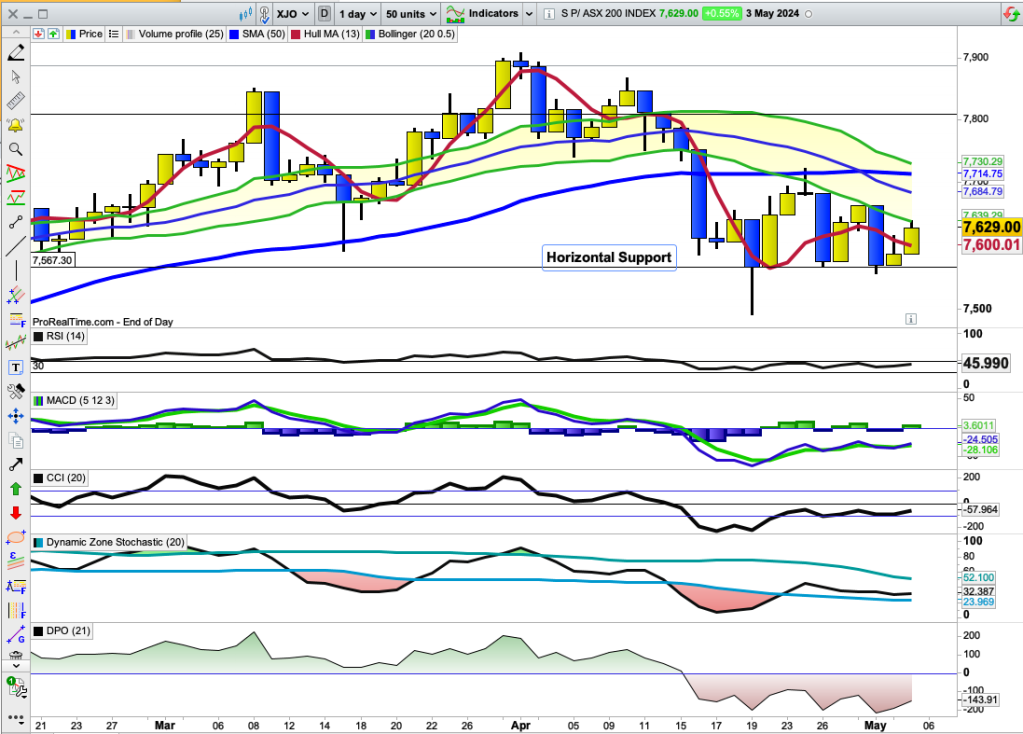
First, the daily chart for the XJO.
XJO has been respecting horizontal support at around 7567 since 19 April. That seems to be a major level for the bears to overcome. XJO was up four out of five days, but the one down day (Wednesday) was a big supply day which wiped out all of the gains on Monday and Tuesday.
Big supply days (selling days) have been a feature of the market now for the past two weeks. Every time the XJO manages a rebound, the bears come in and sell the market back down. But they haven’t been able to break horizontal support, so far.
All indicators remain in their bearish zones. We have to presume that the bears have control until we see a higher high and a higher low.
Meanwhile the American market is on the threshold of breaking its bearish sentiment.
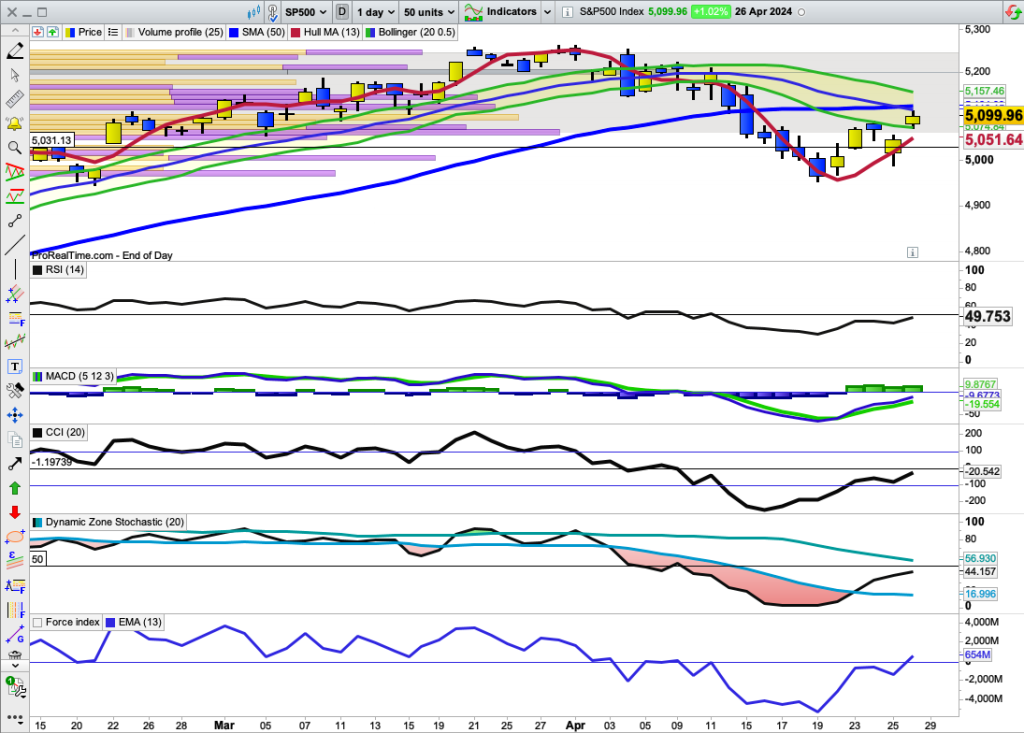
SP500
SP500 jumped out of the blocks on Friday after a poor Jobs Report – the market assuming that means the prospect of lower interest rates. After that great start to the day – that’s more or less where the index finished the day – stymied by dynamic resistance of the 50-Day MA. That needs to be overcome for the market to prove its bullish credentials.
All indicators except the Detrended Price Oscillator (DPO) are back in their bullish zones – that’s a plus.
You’ll not that this is not the first time that SP500 has butted up against the 50-Day MA. It may not be the last time.
The Australian market will, no doubt, follow the U.S. higher on Monday but will surely be unable to establish a new bullish mark. Sydney Futures for Monday are up +0.29%, ensuring a positive start to trading on Monday.
The Australian market is in the midst of Reporting Season. Two notable misses this week were Macquarie and Woolworths. Macquarie was down -2.22% on Friday and continues to respect its down-trending 20-Day MA, which is much lower than its 50-Day MA. That’s a recipe for further downside.
Woolworths missed on Thursday and fell -4.15% and set a new 52 Week low. How much lower? Incongruously, WOW continues to be bashed for price gouging in the press and in the Senate. Beats me.
Sector Performance sthis week.
Best performer this week was Property (XPJ) +3.14%. That’s an interest rate sensitive sector. The next two best performers were also interest rate sensitive stocks, Technology (XIJ) +2.31% and Discretionary (XDJ) +2.14%. Those figures are telling a story – and that was before the Jobs Report on Friday in America, which hinted at further interest rate drops.
The worst performers were Staples -2.28% and Energy -1.81%. Staples was, of course, impacted by the big fall in WOW. Energy has been in a long down-trend, and WDS is now setting new 52-Week lows. I keep watching for a turn-around in Energy – but it still remains stubbornly bearish.
XEJ Daily
The sell-down in Energy has been unrelenting since early April. Friday saw the first bullish engulfing candle since 11 April. That’s an indication that some demand is returning to the Energy Sector. But we need to see a lot more before concluding that his downtrend is over.
Positive Divergences on CCI and DZ Stochastic also hint at a possible turn-around. But we have to see more positive price action.
Sector Performance – last four weeks.
The above graph shows the performance of the eleven ASX sectors + corporate bonds over the past four weeks.
This is a handy way of showing the mind-set of Investors, particularly the large investors who determine the direction of the market.
All groups are down, but the best relative performer is the Cyclical Group -0.21%.
Second was the Defensive Group -0.89%.
Third was the Sensitive Group -3.37%
Until we see both the Cyclical and Sensitive Groups out-performing the Defensive Group, the mind-set of Investors is definitely on the bearish side. This week has made a start in that direction
% of stocks above key Moving Averages. 200DMA, 50DMA, 10DMA
All three metrics lifted this week – that’s a good start, but % Stocks below 50-DMA and 20-DMA remain in bearish territory – below the 50% mark. But that could easily crack in the next week if the favourable move in stocks continues.
Long-Term Investment Indicator
My Long-Term Investor Indicator is based on New Highs minus New Lows Cumulative. While the NH-NL CUM line remains above its 10-Day MA, the Long-Term Investor can maintain their bullish positions.
This indicator, which is a lagging indicator, went bullish in mid-December and has remained bullish since then despite the recent pull-back. On only one day, so far, has NH-NLs shown a negative number, but the NH-NL Cum line is getting perilously close to its 10-Day MA. It wouldn’t take much to throw it into negative territory.
This indicator trends very strongly. When it does change direction from bullish to bearish, the change should be carefully noted. and action taken.
Conclusion.
There have been positives this week in sections of the market, notably, Lithium, Uranium and Property. But despite the positve result in the XJO this week, we still need to see further upside before concluding that the bearish pull-back is over. It could just as easily roll-over as go to the bullish side.
Warren Buffett held his annual Berkshire-Hathaway Meeting this week-end. Investors hang on his lips for every word from the “Oracle of Omaha” – not that there is anything which would help anybody in their investment decisions. It is always ex post facto. Nevertheless, it always provides interesting reading if you’re having a slow Sunday. Highlights from CNBC can be read here.
Dow Jones +0.38%. SP500 +0.32%. Nasdaq +0.35%. Small Caps +0.66%. Banks -0.1%.
Tesla was up 15% last night which helped SP500 and Nasdaq into respectable territory. Bonds were down last night and so was Energy – both were supportive of the stock market.
It’s a big week for news this week. Amazon reports on Tuesday. Apple on Thursday. The Fed meets for a two day meeting and a Jobs Report comes out on Friday. Anything can happen this week as the market will be jerked around by announcements.
SP500.
SP500 has paused at the 50-Day MA – that’s the critical support/resistance level on the chart.
Most of my indicators are now on the bullish side of middle lines or zero lines. The only one that isn’t is CCI, just below its middle line. So the market seems to be setting up for a move to the upside.
Price is always the final arbiter. I want to see SP500 above the 50-Day MA before cheering.
Commodities.
Commodities Index flat -0.08%. Energy -0.57%. Base Metals +1.88%. Agriculture fell heavily -3.61%. Gold remains in consolidation -0.2%.
ASX fell into negative territory just after the start, down -0.05% after 15 minutes of trading.
Most Sectors are down, but Materials (XMJ) is keeping the ASX more or less on a level keel, up +0.73%.
It was a short week this week with the ASX closed on Thursday for Anzac Day.
The first three days of the week were positive – but that took the XJO up to its first hurdle. It stumbled on Friday at that level and fell back strongly after disappointing CPI figures.
It’s often scary just how well Technical Analysis works.
On Wednesday, the XJO hit the 50-Day MA and retreated back to its opening level, finishing flat, down just -0.01%.
That rejection at the 50-Day MA was ominous. On Friday, XJO fell heavily from Wednesday’s close. Friday was down -1.39% and most of the gains on Monday and Tuesday were erased.
XJO finished up for the week, just +0.11%. Virtually flat.
That was in stark contrast to the American market where SP500 was up +2.67% mostly on the back of surging Tech stocks such as Alphabet and IBM.
SP500
Despite the good rise this week, SP500 now faces a technical challenge similar to that of the XJO.
SP500 has risen to the confluence of the 30-Day MA and the 50-Day MA. It if fails here on Monday, then we can expect more downside.
If SP500 breaks above those two MAs, then the recent down side correction is probably over.
I have five indicators below the main chart. Four out of the five remain below their important mid-lines or zero lines, i.e., on the bearish side. Only the Force Index has managed a small break above its zero line.
A solid rise by the SP500 will take all indicators above their dividing lines between bullish and bearish.
The odds currently favour the downside.
Sector Performance – last four weeks.
The above graph shows the performance of the eleven ASX sectors + corporate bonds over the past four weeks.
This is a handy way of showing the mind-set of Investors, particularly the large investors who determine the direction of the market.
Cyclical Group, down -5.43%.
Sensitive Group, down -5.08%
Defensive Group, down -1.6%.
All groups are down, but the best relative performer is the Defensive Group -1.6%.
Until we see the Cyclical and Sensitive Groups out-performing the Defensive Group, the mind-set of Investors is definitely on the bearish side.
Stocks to follow.
Not all stocks lie in the bearish state. Some remain relatively bullish but are currently undergoing modest pull-backs. Watch these stocks to see if they bounce – which could lead to a tradable rally.
ORG
AWC
NST
Min
WHC
STO
Here’s a chart for Origin (ORG)
Until Friday, ORG had closed above the 10-Day MA (light blue line) every day since 26 March.
On Friday, ORG was down and closed below the 10-Day MA and the Hull MA13 has turned down – a very short-term sell signal. ORG has been very strong and any pull-back is likely to be bought.
The above does not imply an immediate “buy” signal – just a set of stocks to watch which might buck the bearish mood of the market.
Do your own research on these stocks – don’t take my word for it. They are offered as suggestions and as an educational posting.
Conclusion.
The ASX is currently in a bearish mood having failed comprehensively at the 50-Day MA. Over the past four weeks, the XJO has lost -4.06% and there is no sign as yet that the downside move is ready to end.
Bear Market Tactics:
If RSI14 is above 60 – assume the market is overbought and will fall.
If RSI14 is under 30 – assume the market is oversold, a bounce will probably occur and it will be a “bear trap”. (RSI is currently at 39.28).
U.S. markets were positive last night after Alphabet and IBM reports.
Dow Jones +0.4%. SP500 +1.04%. Nasdaq +2.03%. Small Caps +0.77%. Banks +0.26%.
SP500.
Since last Friday, SP500 has had a solid rebound of +2.6%. Now we find out if this is a rally to be sold into or the continuation of a bullish trend.
The Index finished last night testing a quadruple resistance – 20DMA, 50DMA, Supertrend (11/2) and hrizontal support/resistance (not shown on the chart). That support/resistance line has touches on 23 Feb., 11 March and 15 March. So we have confluence of several important resistance/support lines. That’s powerful stuff.
The three Super Trend Lines are mixed – two yellow (bullish) and one blue (bearish). That indicates that the trend which has been down could be switching to the upside.
Under most conditions, such powerful resistance would hold. I’m expecting a downside move here – but anything can happen in the great stock market casino.
Commodities.
Commodities Index flat +0.08%. Energy flat +0.05%. Base Metals flat +0.1%. Agriculture -0.5%. Gold +0.32%. Gold continues to hug its 20-Day MA as support.
Sydney Futures last night were up +0.32. . The ozzie market should have a positive start to the day on Monday.
Dow Jones -0.98%. SP500 -0.46%. Nasdaq -0.64%. Small Caps -0.82%. Banks -1.14%.
The U.S. market is push in yo-yo fashion these days as it is in the throes of reporting season, plus the unknowables of economic data. Last night in the U.S., indices fell heavily at the opening after responding poorly to META’s report. (META is the parent company of Facebook.)The major indices in the U.S. opened with a big gap down but recovered a lot of ground intra-day – particularly evident in the Nasdaq with its big white candle.
Now, in after-hours trading in the U.S., Alphabet (parent of Google) and IBM have reported – and overnight Futures in America have risen strongly, again, most evident in the Nasdaq. Nasdaq futures now up +1.1%. That is likely to have flow-on effects to Australia, particularly in the Tech Sector.
SP500
SP500 was down -0.46%, but the effect of intra-day buying can be seen in the long lower tail and the yellow (positive body).
SP500 remains below both the 50-Day MA and the 20-Day MA which are looking at an imminent negative x-0ver (a death cross). It SP500 can negate that negative x-over by breaking above both those indices, then the down trend is over.
Commodties.
Commodities Index +0.55%. Energy +0.52%. Base Metals +1.1%. Agriculture -1.39%. Gold +0.6%.
Overnight Oz Futures down -0.34%.
BHP has announced a huge take-over offer for Anglo-American. That will negatively affect BHP’s price and positively affect Anglo-American (not an Australian company).
It depends on how you want to define it. Here are three different definitions:
The market falls more than 20%. (Usually accepted definition)
The market falls more than 10%. (Sometimes called a correction.)
Investors become risk averse. (Subjective assessment.)
The first two are objective criteria – and the current market doesn’t meet the criteria. SP500 is down -5.9% since the end of March. Dow Jones down -5.66% from the end of March till Wed. 17 April. XJO down -5.28% in the same time.
The third criteria is subjective. Given the current down trends in major indices – I think we can say investors are risk averse. CNN’s Fear and Greed Index is now in the Fear section of their guide.
If we look at some well known stocks in the U.S. Market, Tesla is down -29% since the beginning of March – its in a bear market. Boeing is down more than -40% since the beginning of 2024.
Another way of assessing investor attitude to risk is to compare the performance of the three groups of sectors I use:
Performance of the three groups over the past month:
Growth Group, -3.63%.
Sensitive Group, -3.35%.
Defensive Group, -0.65%.
The Defensive Group has performed considerably better (although negative) than the Growth or Sensive Groups which are both down ~3%, while the Defensive Group is down just -0.65%. That’s fairly good evidence that there’s been a shift out of risky assets into defensive assets. Investors have become risk averse. Fear has become the dominant factor in investors’ psyche.
XJO Daily Chart.
(The above chart uses PRT Bands, which shows the XJO entering a medium-term bullish market from 6 December, 2023, until 16 April. The chart is now medium-term bearish from Tuesday, 16 April.)
XJO fell heavily on Friday, down -2% intra-day, then rebounded to be down -0.98%. It regained about half the losses during the first part of the day’s trading. That’s an impressive performance – made more important by its rebound off horizonal support set in mid-February.
On 14 February, XJO fell -1.52% intra-day, then finished down -0.74%, i.e., it regained about half the original loss. That’s similar to the performance on Friday by the XJO (although the magnitude was a little greater).
14 February proved to be a short-term low which led on to a substantial bullish rally.
That could happen again now for the XJO. The big difference between the two situations is the 50-Day Moving Average.
The 50-Day MA is one of the key MAs watched by big institutional investors. (20DMA and 200DMA are two others).
In February, the XJO was above the 50-DMA, so investors had encouragement to re-enter the market.
Now, the XJO is well below the 50-DMA, so the same mind-set may be absent in this situation.
We will probably see a rebound here. Whether or not this is the end of the pull-back from the end of March is unknowable. If, however, any rally is sold into and another leg down occurs – then bear market conditions continue to apply.
Watch what happens to RSI14. If the market begins to fall again as the RSI14 reaches 60 – then it’s best to assume bear market conditions.
Bear Market Tactics:
If RSI14 is above 60 – assume the market is overbought and will fall.
If RSI14 is under 40 – assume the market is oversold, a bounce will probably occur and it will be a “bear trap”.
Yes, dear Reader, I’ve succumbed to Headline Writer Syndrome. That’s where a headline writer says something outrageous to catch the reader’s attention.
So today – I’ve put in the Headline an outrageous term – Death Cross. And what exactly is that? Is it really as ominous as it sounds? I shall equivocate.
Maybe – or maybe not.
In Technical Analysis a Death Cross occurs when the 20-Day MA crosses below the 50-Day MA. (Or, alternatively, when the 50-Day MA crosses below the 200-Day MA.)
A 20/50 crossover supposedly gives a sell signal to traders/investors. Now, moving averages by their nature are lagging indicators, and 20-Day and 50-Day Moving Averages lag a lot. So a death cross usually occurs after the chart has fallen quite a bit, in fact, usually quite a lot. You can see that on the current Dow Chart above.
A Death Cross is anything but perfect as a sell indicator. In fact, the Dow now looks like it is putting in a bottom – so the fall could be over.
Maybe – maybe not. It could rally and hit resistance of either the 20-DMA or the 50-DMA and fall again – sell the rally. Or, the Dow could just keep on going straight up and test the recent high.
So – the Death Cross isn’t something to worry about too much – but it is a signal that something isn’t right with the market – watch for a rally and see what happens when it hits resistance.
Dow Jones +0.56%. SP500 -0.88%. Nasdaq -2.05%. Small Caps +0.89% (Another death cross.) Banks +1.93%.
Those results in the major indices are all over the shop. Blame reporting season.
The Dow only consists of 30 stocks. So an outsize move, as often happens in reporting season, can shift the Dow quite a bit, particularly if it is one of the larger components. (The Dow is cap weighted, i.e., the largest stocks have a much bigger weighting than smaller stocks in the Index).
Last night, American Express reported and rose 6%. It is one of the bigger stocks in the Dow Jones, so that result shifted the Dow to the upside. Netflix, in the Nasdaq, reported and fell nearly -10%. Meanwhile, NVIDIA, which is an AI stock and in the Nasdaq, fell 10% helping to shift the Nasdaq to the downside. Falls in Apple -1.22% and Tesla -1.92% didn’t help the case for the Nasdaq.
SP500
SP500 remains in a steep down-trend and has been down six days in a row.
DZ Stochastic is now in deep oversold territy and beginning to flatten out. CCI has kicked up a little – so a move to the upside could come soon.
Commodities.
Commodities Index +0.47%. Energy didn’t shift from its opening price 0.00%. Base Metals +1.39%. Agriculture +2.24%. Gold +0.31%.
Gold has been consolidating sideways since the previous Friday’s big fall. Something has to give shortly.
Yesterday in Australia.
XJO fell heavily -0.98%. All 11 sectors were down.
XJO hit horizontal support from the low of 14 February. On that date, the XJO kicked up off its lows and led on to a tradable rally.
Yesterday, XJO kicked up off its lows after a very heavy fall of -2% to halve that fall and finish down -0.98%. So we might get a bounce here. It may not be, however, a medium term tradable rally as in February. Back then, XJO was above its 50-Day MA. Now the XJO is well below the 50-Day MA so any rally is likely to be sold into. Fortunes will probably depend on how the American reporting season goes – always an unknown factor.