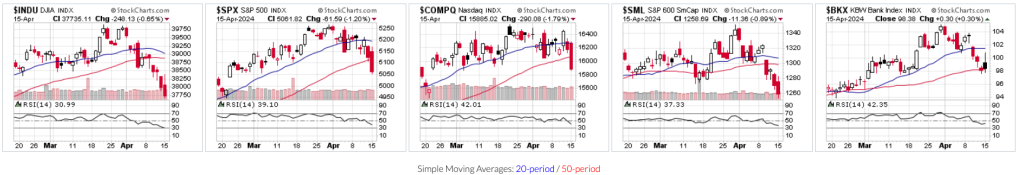
Dow Jones -0.21%. SP500 -0.02%. Nasdaq +0.2%. Small Caps +0.14%. Banks -0.44%.
SP500
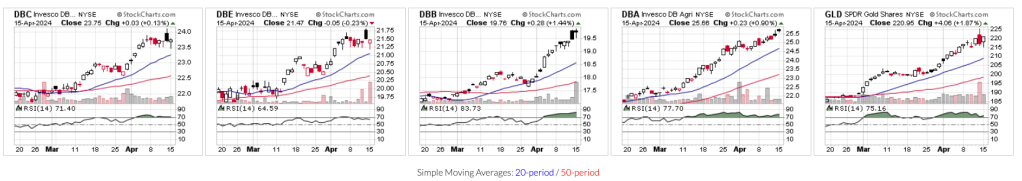
Commodities.
Commodities Index +0.64%. Energy +0.63%. Base Metals +1.92%. Agriculture down heavily -4.86%. Gold back down to support at the 20DMA, -1.12%. Gold is likely to rise from that support.
Iron Ore +0.32%.
Despite Iron Ore being up and Copper hitting a two-year high last night, BHP was flat overnight in the U.S. BHP +0.02%.
Here’s the chart for Copper:
Copper is in a strong up-trend. The red metal is often taken as a proxy for economic growth. It is in a strong up-trend – which suggests there’s nothing much wrong with world economics. Another indication that Central Banks won’t be in a hurry to cut interest rates any time soon?
Copper is an increasingly big part of wealth for BHP as it has been divesting itself of coal mining projects. It is also the reason behind BHP’s recent tilts at taking over the huge miner, Anglo-American. Not withstanding all of that, BHP’s stock price continues to languish.
Here’s the chart for BHP in the U.S.:
BHP has been in a sideways channel since early this year. It will find direction when it breaks one way or the other out of that channel.
Sydney Futures are down a little this morning -0.1%. That suggests a weak opening.
Yes, dear Reader, I’ve succumbed to Headline Writer Syndrome. That’s where a headline writer says something outrageous to catch the reader’s attention.
So today – I’ve put in the Headline an outrageous term – Death Cross. And what exactly is that? Is it really as ominous as it sounds? I shall equivocate.
Maybe – or maybe not.
In Technical Analysis a Death Cross occurs when the 20-Day MA crosses below the 50-Day MA. (Or, alternatively, when the 50-Day MA crosses below the 200-Day MA.)
A 20/50 crossover supposedly gives a sell signal to traders/investors. Now, moving averages by their nature are lagging indicators, and 20-Day and 50-Day Moving Averages lag a lot. So a death cross usually occurs after the chart has fallen quite a bit, in fact, usually quite a lot. You can see that on the current Dow Chart above.
A Death Cross is anything but perfect as a sell indicator. In fact, the Dow now looks like it is putting in a bottom – so the fall could be over.
Maybe – maybe not. It could rally and hit resistance of either the 20-DMA or the 50-DMA and fall again – sell the rally. Or, the Dow could just keep on going straight up and test the recent high.
So – the Death Cross isn’t something to worry about too much – but it is a signal that something isn’t right with the market – watch for a rally and see what happens when it hits resistance.
Dow Jones +0.56%. SP500 -0.88%. Nasdaq -2.05%. Small Caps +0.89% (Another death cross.) Banks +1.93%.
Those results in the major indices are all over the shop. Blame reporting season.
The Dow only consists of 30 stocks. So an outsize move, as often happens in reporting season, can shift the Dow quite a bit, particularly if it is one of the larger components. (The Dow is cap weighted, i.e., the largest stocks have a much bigger weighting than smaller stocks in the Index).
Last night, American Express reported and rose 6%. It is one of the bigger stocks in the Dow Jones, so that result shifted the Dow to the upside. Netflix, in the Nasdaq, reported and fell nearly -10%. Meanwhile, NVIDIA, which is an AI stock and in the Nasdaq, fell 10% helping to shift the Nasdaq to the downside. Falls in Apple -1.22% and Tesla -1.92% didn’t help the case for the Nasdaq.
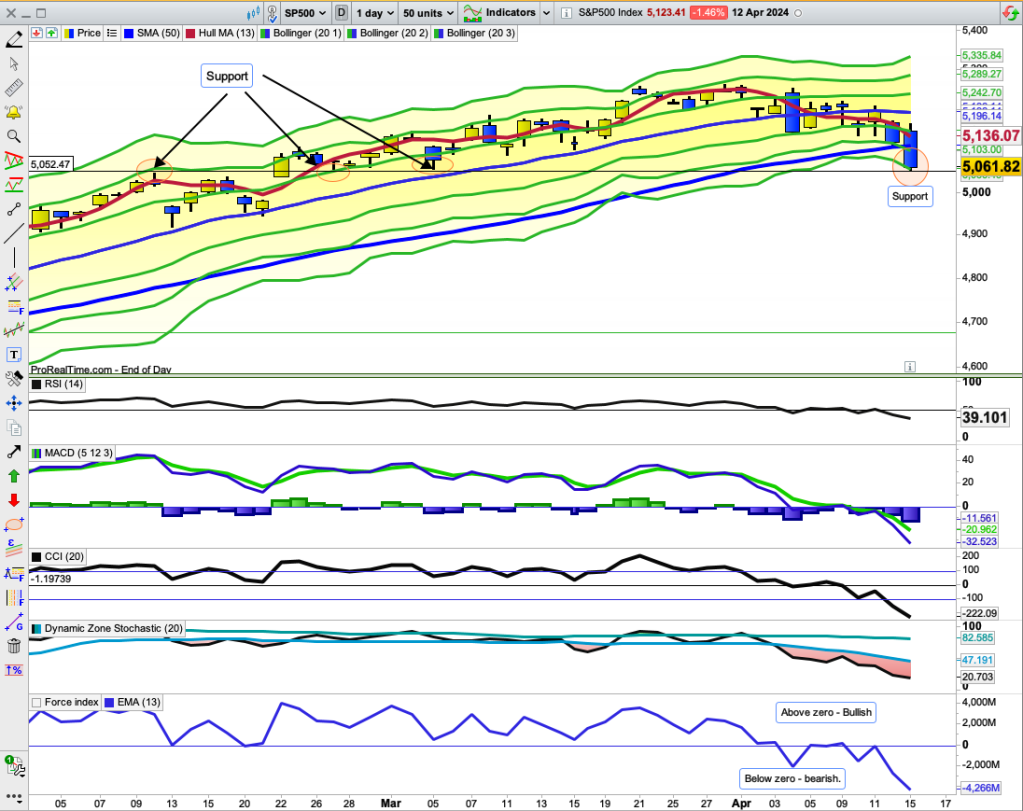
SP500
SP500 remains in a steep down-trend and has been down six days in a row.
DZ Stochastic is now in deep oversold territy and beginning to flatten out. CCI has kicked up a little – so a move to the upside could come soon.
Commodities.
Commodities Index +0.47%. Energy didn’t shift from its opening price 0.00%. Base Metals +1.39%. Agriculture +2.24%. Gold +0.31%.
Gold has been consolidating sideways since the previous Friday’s big fall. Something has to give shortly.
Yesterday in Australia.
XJO fell heavily -0.98%. All 11 sectors were down.
XJO hit horizontal support from the low of 14 February. On that date, the XJO kicked up off its lows and led on to a tradable rally.
Yesterday, XJO kicked up off its lows after a very heavy fall of -2% to halve that fall and finish down -0.98%. So we might get a bounce here. It may not be, however, a medium term tradable rally as in February. Back then, XJO was above its 50-Day MA. Now the XJO is well below the 50-Day MA so any rally is likely to be sold into. Fortunes will probably depend on how the American reporting season goes – always an unknown factor.
I had to feel for the leader writer on CNBC last night. Soon after the opening in the U.S. he wrote (this is a paraphrase):
Dow surges more than 300 points on the back of good retail figures overshadowing the Israel/Iran conflict.
A few minutes later he wrote (paraphrase):
Dow surges more than 200 points on the back of good retail figures overshadowing the Israel/Iran conflict.
A few minutes after that he wrote (paraphrase)
Dow surges more than 100 points on the back of good retail figures overshadowing the Israel/Iran conflict.
Soon after that the Dow was nudging zero for the opening session
The poor guy, even though the Dow had fallen 200 points from the opening, he couldn’t give up his natural optimism that the Dow was “surging”.
The Dow finished down about -250 points and it was the best of the three major indices.
Dow Jones -0.65%. SP500 -1.2%. Nasdaq -1.79%. Small Caps -0.89%. Surprisingly, Banks survived the carnage, +0.3% but suffered from plenty of intra-day selling.
SP500.
SP500 is now down three standard deviations from the 20-Day MA. That’s getting a bit extreme. Plus it has reached a major support level. So we may see a bounce here in the SP500. But, Bears have the upper hand for now. The 50-Day MA and 20-Day MA both present as possible resistance levels. Look for a fall after hitting one of those.
The mantra has now changed from “buy-the-dip” to “sell-the-rally”.
This may, of course, just be a knee-jerk reaction of Middle East events and we will see a V shaped recovery. I think, however, that the context of a re-acceleration in inflation makes that less likely. The current fall has been brewing for some time.
Commodities.
Commodities Index +0.13%. Energy -0.23%. Base Metals +1.44%. Agriculture +0.9%. Gold +1.87%.
Ozzie Futures are well down overnight guaranteeing a weak opening. SPI -0.81%
Dow Jones -0.49%. SP500 -0.65%. Nasdaq -0.96%. Small Caps +0.49%. Regional Banks +0.72%.
Dow Jones and Nasdaq both drop below their 20-Day MAs. That’s a dangerous level for Indices.
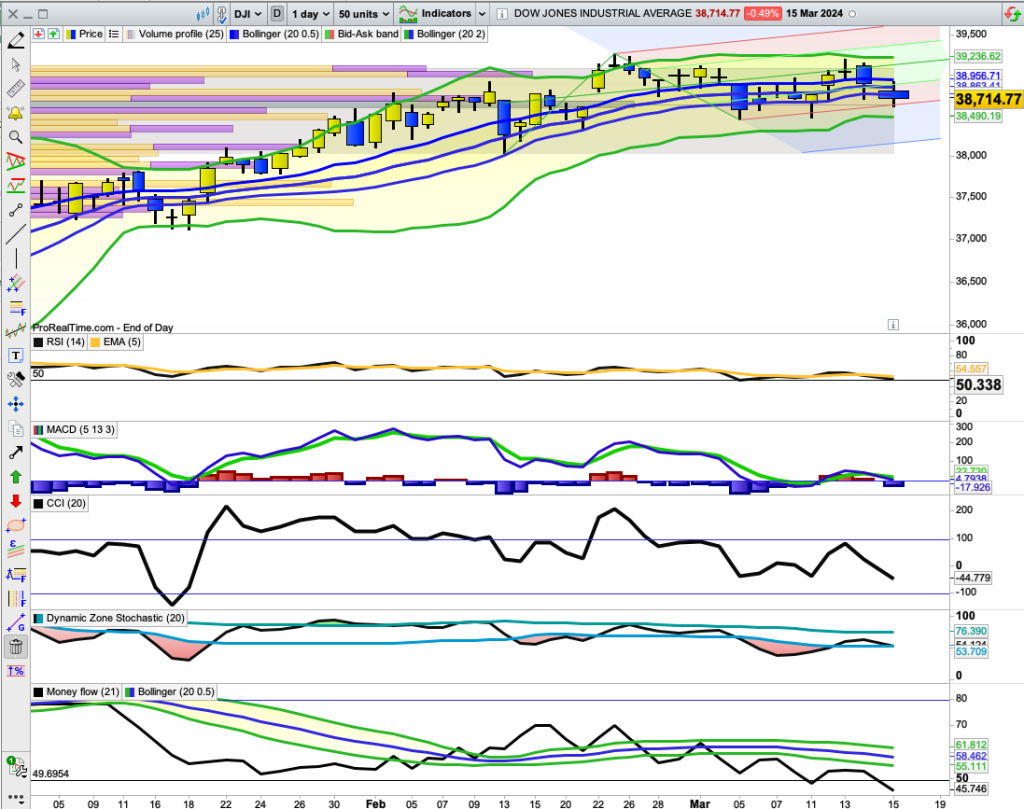
Dow Jones Chart.
Dow Jones is teetering on the edge. It closed below the narrow Bollinger Bands (20/0.5) as it did on 5 March, and then recovered.
Indicators are mixed. RSI 14 remains above its mid-line, MACD (5/13/3) remains above its zero line. CCI is below its zero line. Stochastic is above its mid-line. Money Flow is below its mid-line. We need to see more uniformity in the Indicators before calling an end to the up-trend. That could occur if Dow Jones has a substantial fall on Monday.
Commodities.
Commodities Index up +0.35%. Energy flat 0.00%. Base Metals continued its stong bull rally, up +1.06%. Agriculture +2.17. Gold -0.32%.
Gold is in a descending triangle pattern. Look for a break out of the triangle (up or down) for further direction.
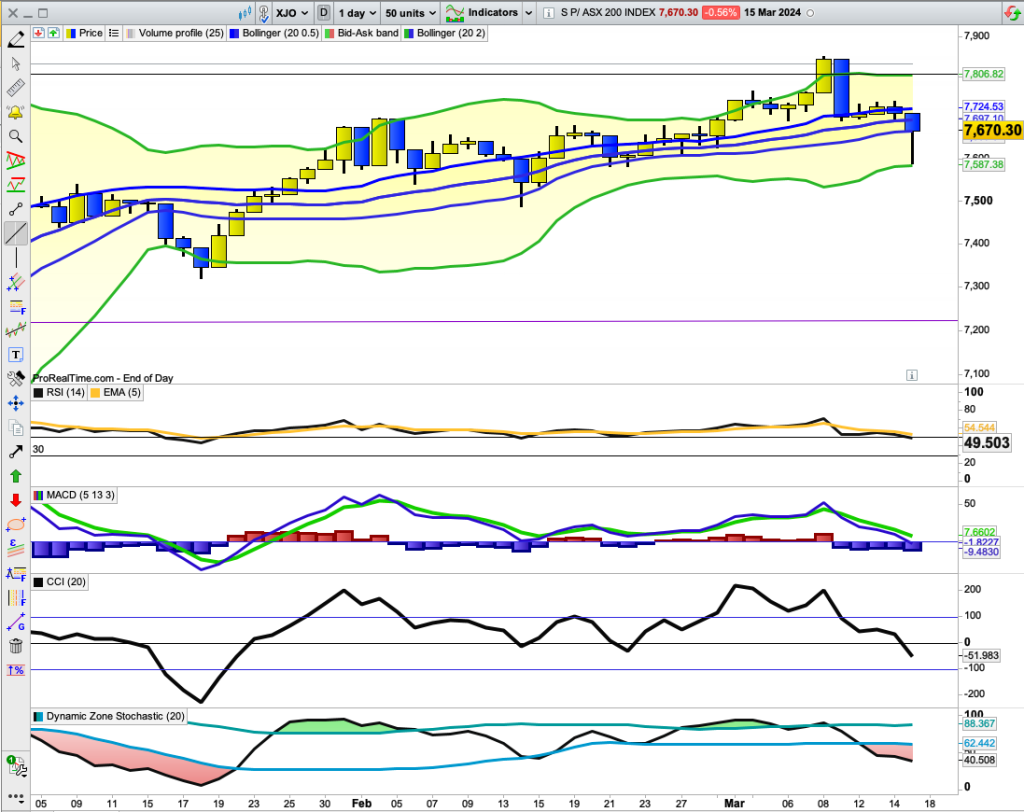
In Australia yesterday, the ASX pulled off a remarkable rebound after being down about -1.5%, it finished down -0.56%.
Yesterday’s rebound looks like the completion of an ABC pull-back. The chart finished at the lower level of the narrow Bollinger Bands (20/0.5) after rebounding off the lower level of the standard Bollinger Bands ((20/2). Indicators are below their relative zero or mid-lines – which is a negative. In the case of the RSI, the fall below its mid-line is marginal.
Look for carry-through buying on Monday from Friday’s finishing level of 7670.3. If we don’t see carry-through buying on Monday, then XJO is in trouble.
Plenty of noise being made in the media this week about new records for SP500 and Nasdaq. Nasdaq best since 2021. Not much mention, however, about the Dow Jones which fell this week by -0.15%.
The original Dow Theory from over 100 years ago was based on the Dow Jones Industrial Average and the Dow Jones Transport Average. According to Dow Theory – the Indices must confirm each other, if one broke to a new high, it would only be confirmed if the other broke to a new high.
Modern views on Dow Theory suggest that the Transport Index is no longer as important as it was. Analysts now focus on the three major indices, Dow Jones, SP500 and Nasdaq, i.e., a new high is only confirmed if all three make new highs. The SP500 and Nasdaq broke to new highs this week, but Dow Jones fell. So, no confirmation.
Using the “old” Dow Theory – Dow Jones Industrial Average made an all time high on 23 February – that was not confirmed by the Dow Jones Transport Average. No confirmation.
Australia did go on to a new all time high in the past week and broke upwards from a month long consolidation. XJO up this week +1.33%.
XJOWeekly Chart
XJO finished at 7745.6. That break-out to a new all time high has ignited a lot of optimism on the part of investors.
Negative divergences on CCI and MACD Histogram are urging investors to be cautious.
For the month of February, XJO was up just +0.23%. February and March tend to be seasonally weaker than prior months like November, December and January. Although positive, February was hardly strong. The seasonal tendency for March is another reason to be cautious.
What’s been happening this week and this month in the Australian Sectors.
Sector Changes last Four Weeks
Seven sectors up, four sectors down. That’s an improvement on the previous week when we had six sectors up. The improver was Staples (XSJ) up 2.22% for the past four weeks.
Best three were XIJ (Information Technology) +19.51%, XDJ (Discretionary) +8.09% and XXJ (Financials) +3.86% . Cyclical or Sensitive groups which suggests there is still plenty of confidence in this market. They are interest rate sensitive – and, although interest rates haven’t fallen, the market is forward looking and expect a fall in interest rates to drop later in the year.
Worst performers were XMJ (Materials) -3.92%, XEJ (Energy) -6.4% and XHJ (Health). XMJ and XEJ are the two resources sectors which depend to a large degree on the Chinese economy which is facing deflationary pressures. XHJ has taken a breather after being very strong for many weeks.
2. Sector Changes this Week.
It’s worth comparing Four Week figures to One Week figures as this can pick up on improvers and back sliders.
Of significance Is XIJ up 7,94% – thus retaining its leadership status in the market.
Big changes have occurred, however, in XMJ (Materials) +3.46% and GDX (Gold Miners) +4.87%. (You may remember that I called Gold Miners as my “roughie of the week” just two weeks ago. I was out on my timing by a week. This week has been great for the Gold Miners and looks likely to continue with Gold up +2.01% on Friday night in the U.S.)
GDX Chart
GDX (Gold Miners) had a big jump in Australia on Friday, up +2.09%. That may have been pre-empting the U.S. Friday night move to some extent, but we should see more flow on to Australia on Monday.
Long-Term Trend.
Cumulative New Highs minus New Lows provides a handy guide to the long term trend for long term investors. It is currently headed up and above its 10-Day MA – bullish. Stay with the trend.
Momentum – Daily and Weekly RSIs.
Comparing Weekly with Daily RSIs is a quick way to see where momentum may be increasing or decreasing.
Decreases are not necessarily a negative. Only if the Daily RSI is below 50 and Daily RSI is below Weekly RSI is it a problem. Sectors in that category are XTJ, XHJ,
Which ever way I measure it, XIJ is the standout sector based on performance and momentum.
Conclusion.
The trend in the broad market is up – stay with the trend.
But, as always, be selective, not all stocks/sectors are created equal. XMJ, XGD and XSJ look to be improvers. XIJ remains the standout sector. Be cautious with XTJ and XHJ.