Weekly Market Wrap. Week ended 19/4/24. Is this a bear market?

Is this a bear market?

It depends on how you want to define it. Here are three different definitions:

  • The market falls more than 20%. (Usually accepted definition)
  • The market falls more than 10%. (Sometimes called a correction.)
  • Investors become risk averse. (Subjective assessment.)

The first two are objective criteria – and the current market doesn’t meet the criteria. SP500 is down -5.9% since the end of March. Dow Jones down -5.66% from the end of March till Wed. 17 April. XJO down -5.28% in the same time.

The third criteria is subjective. Given the current down trends in major indices – I think we can say investors are risk averse. CNN’s Fear and Greed Index is now in the Fear section of their guide.

If we look at some well known stocks in the U.S. Market, Tesla is down -29% since the beginning of March – its in a bear market. Boeing is down more than -40% since the beginning of 2024.

Another way of assessing investor attitude to risk is to compare the performance of the three groups of sectors I use:

  1. Growth Group: Materials, Discretionary, Financials, Property.
  2. Sensitive Group: Telecommunications Services, Energy, Industrials, Information Technology.
  3. Defensive Group: Staples, Health, Utilities, Composite Bonds.

Performance of the three groups over the past month:

  1. Growth Group, -3.63%.
  2. Sensitive Group, -3.35%.
  3. Defensive Group, -0.65%.

The Defensive Group has performed considerably better (although negative) than the Growth or Sensive Groups which are both down ~3%, while the Defensive Group is down just -0.65%. That’s fairly good evidence that there’s been a shift out of risky assets into defensive assets. Investors have become risk averse. Fear has become the dominant factor in investors’ psyche.
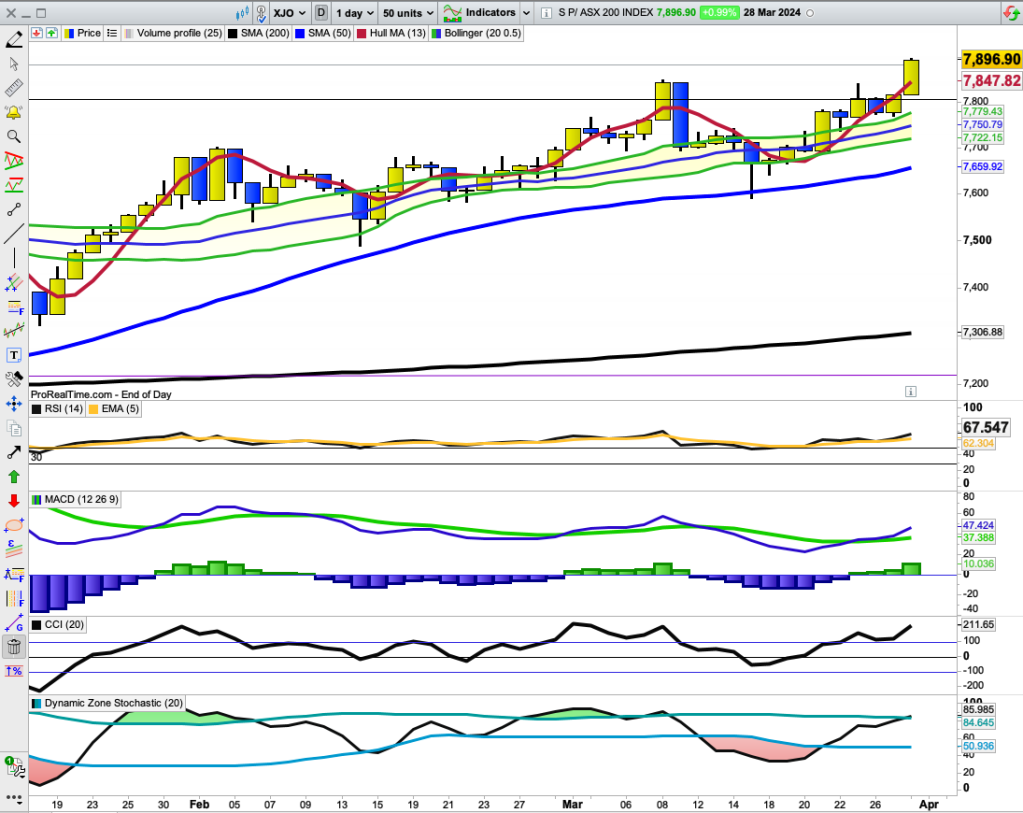
XJO Daily Chart.

(The above chart uses PRT Bands, which shows the XJO entering a medium-term bullish market from 6 December, 2023, until 16 April. The chart is now medium-term bearish from Tuesday, 16 April.)

XJO fell heavily on Friday, down -2% intra-day, then rebounded to be down -0.98%. It regained about half the losses during the first part of the day’s trading. That’s an impressive performance – made more important by its rebound off horizonal support set in mid-February.

On 14 February, XJO fell -1.52% intra-day, then finished down -0.74%, i.e., it regained about half the original loss. That’s similar to the performance on Friday by the XJO (although the magnitude was a little greater).

14 February proved to be a short-term low which led on to a substantial bullish rally.

That could happen again now for the XJO. The big difference between the two situations is the 50-Day Moving Average.

The 50-Day MA is one of the key MAs watched by big institutional investors. (20DMA and 200DMA are two others).

In February, the XJO was above the 50-DMA, so investors had encouragement to re-enter the market.

Now, the XJO is well below the 50-DMA, so the same mind-set may be absent in this situation.

We will probably see a rebound here. Whether or not this is the end of the pull-back from the end of March is unknowable. If, however, any rally is sold into and another leg down occurs – then bear market conditions continue to apply.

Watch what happens to RSI14. If the market begins to fall again as the RSI14 reaches 60 – then it’s best to assume bear market conditions.

Bear Market Tactics:

  1. If RSI14 is above 60 – assume the market is overbought and will fall.
  2. If RSI14 is under 40 – assume the market is oversold, a bounce will probably occur and it will be a “bear trap”.

Good luck.

Weekly Wrap. Week ended 14/4/24

I have just one word imprinted on my frontal lobes this week – that’s where executive functioning occurs. The one word is: SELL. Why? Have a look at the chart for IOZ – the largest ETF tracking the XJO:

I’ve notated this chart quite heavily – so it should be self-explanatory.

But – to put it all into point form:

  • IOZ was in a bearish rising wedge which broke to the downside this week.
  • That break also coincided with a failure to rise back into the narrow Bollinger Bands (2/0.5) marked on the chart.
  • RSI14 broke below its 50 line – the line between bullish and bearish zones.
  • Short term MACD (5/13/3) broke below its zero line this week.
  • CCI broke below its zero line this week.

The one remaining piece of the puzzle is the 50-Day MA which was providing support. Friday night in the U.S., major indices fell heavily. (Dow -1.24%, SP500 -1.46%, Nasdaq -1.62%). Now we have the tragic news of Iran attacking Israel.

That 50-Day MA support level will break on Monday. Welcome to a bear market.

sp500 Daily Chart

The SP500 shows a similar set of bearish conditions as the Ozzie market. Break down on the chart itself with support at the 50-Day MA. Break downs on indicators. Given the events in the Middle East, the 50-Day MA will fail as support. Likely target is the Point of Control shown on the chart – which is about 7% below the current level.

All eleven U.S. Sectors were down on Friday night. The best, relatively, was a Defensive Sector, Utilities -0.76%. The next best, relatively, was another Defensive, Staples -1.01%. The worst was a Cyclical Sector, Materials -1.77%.

Very Strong Stocks versus Very Weak Stocks

The current bearish situation hasn’t come out of the blue. The context has been building for some time and obvious in the perrformance of Very Strong Stocks versus Very Weak Stocks.

Each week, I rate every stock in the ASX100 on the basis of seven criteria, with a possible total of 14 points for a Very Strong Stock and Zero for a Very Weak Stock. I then take a five week average of the total summed results for the Very Strong and Very Weak Stocks.

Here’s the weekly chart which goes back to February 2022.

The most recent peak for Very Strong Stocks occurred back in mid-February, 2024 which was two months ago. The chart for Very Strong Stocks has been falling since then. That peak was also equal to the next most recent peak which occurred back in late December, 2023. So we’ve had a double top occur in the Very Strong Stocks. Remember that this is a lagged indicator so the actual situation is now much worse than indicated in this chart.

Internals can fall while the market continues on upwards if strength remains in a few large cap stocks. That is what has been happening in the Ozzie Market.

The largest sector in the Ozzie market is Financials, which contains, of course, the big banks.

Daily Chart for Banks

The Daily Chart for Banks topped on 8 March and has developed a bearish trend since then. The broad market has gone on to a new all time high at the end of March. So the banks, probably the most important sub-index in the Australian market, hasn’t confirmed the recent high. That’s another non-confirmation indicating that there was something not quite right with the Australian market.

Gold Miners Index

Gold Miners (GDX) in contrast to the Banks has been in a strong up-trend – clear in the above chart.

Gold, of course, is one of the go-to items in times of inflation and geo-political tensions – the ultimate “safe haven”. We can expect further divergence between Gold Miners and the Banks on Monday and probably at least for the next week. It’s difficult to see the Middle East crisis resolving quickly despite Iran saying it has concluded its direct attack on Israel. (From the BBC: Iran suggests it will not launch further strikes.)

That’s enough doom and gloom for this week.

I can only hope all the carnage in the Middle East and Ukraine can end. There seems no end in sight in either theatre.

Good luck

New all time high for XJO today. 28/3/24

XJO up today +0.99% to finish at 7896.9. Next stop? 8000?

XJO is still not overbought with an RSI(14) at 67.55. The overbought level kicks in at 70. The last time we saw an RSI above 70, the XJO fell -1.82% the next day.

What’s more important is the 40 line on the RSI. Start to worry when RSI falls below 40. The last time we saw that was back in early November, 2023. That’s about five months ago. Since then, the XJO has rallied about 17%.

All sectors were up today led by Materials +1.08%. Financials was weakest (relatively) up +0.38%.

I think we are starting to see rotation going in the market with weaker areas becoming stronger and the previous strongest becoming (relatively) weaker.

That appears to be evident today. Materials has been relatively weak for many weeks, while Financials was relatively strong.

Here’s the chart for Financials. The panel to look at is the bottom pane.

The bottom panel compares the XXJ to the XJO. It is currently trending down, i.e., it is doing worse than the xjo.

Here’s the chart for Materials. Again the panel to look at is the bottom panel.

The bottom panel is trending up, i.e., XMJ is doing better than the XJO. And that means that the XMJ is doing much better than Financials. Time to change allocations?

Have a great Easter.

Weekly Wrap. Week ended 22/3/24.

XJO was up +1.36% this week putting an end to the ABC pull-back which began on 11 March and lasted. five days.

8 March set a new all time high for the XJO of 7854. XJO finished Friday at 7771. XJO is currently just -1.05% below its all time high and remains in a strong up-trend.

Daily Chart for XJO

Since mid-January, XJO hasn’t closed below the lower band of the narrow Bollinger Bands (10/05). That support level came under serious threat twice since mid-January (14 February and 15 March) but recovered both times to reverse to the upside.

RSI(14) has only breached its mid-line once since mid-January. That was at the end of the ABC pull-back. On 15 March, RSI(14) fell to 49.5 – not a serious breach. That day was a wide-range down day with a long lower tail – indicating plenty of intra-day buying. The market then recovered.

Until otherwise indicated, the trend is up – stay with the trend. Look to buy dips and pull-backs.

NewHighs minus NewLows Cumulative.

This chart is a good long-term trend indicator. It is a lagging indicator and is often late to signal the start of a trend and to finish a trend. While it is trending up and remaining above its 10-Day Moving Average, long-term investors can rest easy.

The trend on this indicator has been inexorably up (despite pull-backs on the XJO) since mid-December. Nervous Nellies might have had the shakes during pull-backs in February and March, but NH-NL Cum would have been a steadying influence.

What’s been happening this week in the Australian Sectors?

  Sector Changes this Week.

Only three sectors were down this week: Staples (XSJ) -0.51%, Utilities (XUJ) -0.33% and Telecommunications (XTJ) -0.12%. XSJ and XUJ are both defensive sectors which tend to do relatively poorly during growth phases of the market cycle.

Materials (XMJ) showed good form this week, +2.35% after hints from the three big miners the previous week that they might be turning around. Energy (XEJ) also did relatively well, up +1.35%. I wouldn’t get too excited about the resource stocks, however, as big volume in OZR (ETF for Resources) suggests some downside to come.

Momentum

Before a stock or sector can turn down, momentum has to slow. A quick way to check momentum is to compare Weekly RSI to Daily RSI:

There are surprises in this graph. The sectors where momentum appears to be improving are XMJ, XEJ, XUJ and XSJ. XUJ and XSJ were both negative this week, so they may be returning to favour. XMJ and XEJ improved after recent weaknesses. But, as noted above, I’m not confident about further upside in the resources.

Other sectors show slowing momentum: XXJ, XDJ, XIJ, XTJ, XHJ, XPJ, XNJ. That doesn’t mean that the sectors will turn down – just a warning sign to be careful.

Put/Call Ratio – New York Stock Exchange.

The P/C Ratio has reached an extreme high. Usually, this occurs as the stock market makes a low. A series of extreme high readings were seen in October, which signalled the end of the bearish correction.

In January, the P/C Ratio soared having a fit of the conniptions when a small pull-back occurred – but the market then continued on its strong up-trend. Most likely, as the extreme high on the P/C Ratio has occurred at an extreme high on the SP500, contrarians will take that as a sign that the bull market will continue.

Conclusion.

The Australian market rallied this week after an ABC pull-back the previous week.

The XJO remains in a bullish up-trend. Stay with the trend until it obviously end. There is no sign yet that an end is in sight.

Good luck.

XJO finishes at a new record today. 21/3/24

XJO up +1.12% today.

Below is a chart for IOZ an ETF for the XJO.

IOZ has pulled up nicely from the ABC pull-back 11-15 March.

The chart is back above the narrow Bollinger Bands (10.0.5) which puts it into bullish territory.

Short-term MACD Histogram (5/13/3) has kicked up above its zero line – that’s a bullish indication. The short-term MACD never fell below its zero line – another bullish effect.

Hull MA13 has turned back to the upside – bullish.

I can’t find much negative in the chart.

Nine out of 11 sectors were positive today. The only two in negative territory were Health and Utilities. Both of those are defensive sectors which usually do relatively worse in growth phases of the market.

Best today were Financials +1.74% and Discretionary +1.5%. Both of those are in the “growth” group of sectors.

Materials finished up +1.04%. BHP was positive today, +0.78% but Rio was negative -0.13%, so the Iron Ore miners are still struggling. FMG did better than the other two big iron ore miners +1.7%.

Gold Miners had a great day +5.68% on heavy volume after a big rise in the Gold price overnight.

Intra-day action was interesting today. Unemployment numbers came out at 11 a.m. and showed a fall in the unemployment rate, and XJO fell from its highs down to about +0.5%, but recovered the losses in the after noon trading (after 1.00 p.m.). Composite Bonds (IAF) also fell on the Unemployment numbers and did not recover. So the bonds and XJO both assumed the worst from the fall in the Unemployment numbers – they might delay any chance of an interest rate cut. Despite XJO rising in afternoon trade, VIX (Volatility Index) also rose in afternoon trading. Usually those two metrics trade inversely, so VIX is indicating the possibility of some negative entering the market in the coming month.

In early overseas trading, Euro STOXX600 is up strongly +0.69%.

Dow Jones Futures are up +0.22%. Nasdaq Futures up +0.63%.

SPI futures on the Sydney Futures Exchange have gone the other way -0.22%. That’s probably a reaction to the strong day on the XJO. Time for a pause?

Finally, here’s the chart for NewHighs-NewLows Cumulative.

This is a long-term indicator for investors. While it remains above its 10-Day MA, long-term investors can sleep soundly. Note that in the XJO pull-back earlier this month, NH-NL Cumulative never deviated from its up trend.

Good luck

Banks hit turbulance, Miners take off. 14/3/24

If you look at the figures for the XJO today, -0.2%, you’d think that not much happened. But that would be wrong. Today was a day of dramatic action, with Banks down -2.83% (after a long up-trend) and Miners up +2.15% (after a long down-trend). So – are we ready to flip from Banks to Miners? Perhaps, but I’d like to see more evidence.

First, a chart for IOZ, an ETF for the XJO

Today’s blue candle indicates that the XJO fell from its opening quote. It wasn’t a big down day (Miners up cancelling out Banks down) and the chart remains above its narrow Bollinger Bands (20/0.5).

While that state of affairs continues to exist – I’d be a buyer rather than a seller.

Banks

MVB (Banks) is now down to the mid-line of the narrow Bollinger Bands (20/0.5). We need to see a close below the lower Bollinger Band to claim a change of trend.

At around the 20-Day MA – middle line of the narrow Bollinger Bands – we can expect dip-buyers to come into the market.

All indicators remain above their mid-lines or zero lines. So no sell signals there.

After such a big down day – I’d expect some buying tomorrow.

Miners

The reverse of the Banks exists with the Miners. A big up taking taking the chart up to the narrow Bollinger Bands.

Indicators have turned up, but not enough to suggest a “buy” signal.

After such a big up day – we can expect the -sell-the-rallies people to enter the market.

It pays to be patient.

Five Sectors up today. Five sectors down. And one flat. Even Stevens.

The best sector was, of course, Materials +1.85%. Almost the inverse for Financials -1.88%.

Sitting on the fence today was Property 0.00%.

Staples had a good day, +0.55%. The flip side of that was, of course, Discretionary -0.73%.

I think we’ll have a positive day tomrrow – and, just to confound everybody, Materials will be down, Financials will be up. What could be more confusing? And that, my friends, is what the market does – confuses everybody – except the smart money, who just keep on making money.

Early trading in Europe sees Euro STOXX600 up +0.22%.

Dow Futures +0.3%. Nasdaq Futures +0.45%.

Ozzie Futures in the overnight market, +0.12%.

And all that looks likely to set up a positive day for the ASX tomorrow.

Weekly Wrap. Week ended 8/3/24.

XJO, SP500 and Nasdaq making new all time highs this week. Dow Jones continues to lag – unable to break above its 20-Day MA.

Leading the charge up this week in Australia have been Financials (XXJ) +3.32%, Information Technology (XIJ) +1.44%, Property (XPJ) +2.61% and Health +1.47%. Interestingly – not one of those four sectors has made all time highs. Financials (XXJ) made its all time high back on March, 2015, although XXJ is just a smidgin below its all time high. After making its all time high in March, 2015 – XXJ (drum roll please) then fell almost 30%. We’re now at the 9th anniversary of that all time high. Is history about to repeat?

Even more interestingly, not a single sector made a new all time high this week. That’s the power of averages and breadth.

What did make an all time high this week, was the Equal Weight Index as measured by Vaneck’s Equal Weight ETF. Here’s the monthly chart going back to 2019.

XJO Weekly Chart

This week, XJO finished at 7847, about 100 points up on the previous week.

The Bearish Rising Wedge remains in play. Dynamic Zone Stochastic is close to a “sell” signal. That occurs when the signal line closes below its upper band. Other indicators are showing negative divergences.

Daily SP500 Chart.

This has been an extra-ordinarily long bull rally on the SP500. It began at the end of October, 2023 and has since risen >25%.

During that period, RSI has not fallen below its 50 line (mid-line) and the chart has not broken below the narrow Bollinger Bands (20/0.5). We’ll know when this trend finishes when we see a break by the RSI below 50 and a break by the chart below its narrow Bollinger Bands.

Friday saw a big bearish engulfing candle on the SP500 so a pull-back seems imminent. We’ll see if the buy-the-dippers come in again at the 20-Day MA or we see significant break-downs in the RSI and narrow Bollinger Bands.

What’s been happening this week and this month in the Australian Sectors.

  1. Sector Changes last Four Weeks

The sectors are broken up into groups: Cyclical, Sensitive and Defensive. In a Bull Market we expect the Cyclical and Sensitive Sectors to out-pace the Defensives. And that’s what this graph shows. Cyclicals are up an average of 4.92%. Sensitives up 4.83%. Defensives down -0.57%. There are anomalies, notably the Resources. Materials -1.54% and Energy -3.65%. That’s a result of the peculiar structure of the Australian market where the Resources are strongly influenced by economic activity in China and not the local economy.

The notable outlier is Information Technology, up +20.14% in the past four weeks – influenced, no doubt, by the big rises in the U.S. Tech sector.

  2. Sector Changes this Week.

The Big Bazooka this week was Gold Miners, up 9.45%. Now Gold Miners (XGD) is actually a sub-section of XMJ but that positive result in XGD wasn’t enough to lift XMJ into positive territory. XMJ down -0.65%. It was joined in negative territory by the other Resources Sector, XEJ, down -0.68%. The only other negative sector was Staples (XSJ), down -0.29%.

Doing much of the heavy lifting this week was Financials (XXJ) up +3.32%, joined by its close sibling, Property +2.61%. (It’s not that long ago that Property was once part of Financials which had the ticker symbol XFJ). XHJ (Health) had a revival of fortunes after a recent slump, +1.47%. XIJ wasn’t as robust this week as in other recent week, up +1.44%. (I have to wonder if we aren’t seeing some rotation in the sectors going on.)

GDX Chart

Gold Miners ETF has now been up seven days in a row. Gold was up again in the U.S. on Friday night so we will probably see another day up on Monday in Australia.

Friday was a wide range day in Australia so a fair amount of volatility is entering the Gold Miners. The chart is at the top of its Value Zone – that’s the wide shaded rectangle. That represents about 70% of trading activity in Gold Miners. So it could be ready for a rest – a consolidation or some pull-back.

Long-Term Trend.

Cumulative New Highs minus New Lows provides a handy guide to the long term trend for long term investors. It is currently headed up and above its 10-Day MA – bullish. Stay with the trend.

Conclusion.

The trend in the broad market is up – stay with the trend.

So far, there’s not much indicating that the current up trend is ready to reverse. That can change in an eye-blink.

Friday night saw a bearish candle on the SP500 which may or may not be the beginning of the end for this bull market.

We’ll know when the trend has changed by seeing if RSI on the SP500 falls below 50 and the chart falls below the narrow Bollinger Bands.

Good luck.

XJO falls after new all time high. 4/3/24

After opening with a new all time high this morning, the XJO fell into negative territory. Down -0.13%.

The chart shows a bearish rising wedge – which is the first bearish chart pattern for a long time.

A break below the support line of the wedge would indicate much lower figures. We could see a fall of around -4%.

Today, four sectors were up while seven were down. Best today was Property (XPJ) +1.34% followed by Information Technology (XIJ) +0.92%. Worst today were Health (XHJ) -0.78%, closely followed by Utilities (XUJ) -0.77%. Resources were again weak, Energy (XEJ) -0.45%, Materials (XMJ) -0.72%.

Gold Miners had a positive day up +3.29% and is now at a critical oblique resistance line.

GDX is in a large bullish falling wedge – in contrast to the XJO which is in a bearish rising wedge.

Indicators all have positive divergences suggesting further upside.

This may be telling us something important about the state of the market. Watch carefully these two charts which often travel in opposite directions.

Good luck

ASX tedium ended? 29/2/24

XJO was up today +0.5%. The range was the widest since Wednesday last week. The Index broke above recent near-term resistance but still faces the highs back in 2/3 February. That’s almost a month with the XJO sliding sideways. It’s not clear yet that the sideways trend has broken but its the nearest we’ve come in nearly a month.

Bollinger Banks, a measure of volatility, have tightened right up so a big move can be expected.

Below is a chart of Historical Volatility over time.

Historical Volatility is down now to lows which have rarely occurred since October 2022. In every single case of very low volatility the market has reversed to the downside. There’s no guarantee that will happen again. We have had a strong bull rally, now followed by a consolidation zone (sideways trend seen in the XJO Chart above). The market could easily set up higher here after such a long consolidation. Watch which way it breaks.

Only one sector was down today, so breadth was good.

Below is a chart for MVW – the “equal weight” ETF for the Ozzie market. This is a good measure of breadth as all stocks are of “equal weight” which is different from the XJO which is “capital weighted”, i.e., large cap stocks have more influence on the chart than mid and small cap stocks.

MVW has clearly broken horizontal resistance to the upside. That may be a leading indicator for the XJO.

Good luck.

Danger, Will Robinson, Danger.

Weekly Market Wrap for the ASX. Week ended 2/2/24

XJO

XJO had a great week, up +1.91%, although that rise was hit by a hiccough on Thursday when it fell -1.2% but recovered on Friday when it rose +1.47%

Wed-Fri were three days of high volatility coming at the top Bollinger Band. That may suggest that the next move will be to the down-side. Negative divergences on RSI and MACD re-inforce the idea that the next move will be to the downside. ASX Futures fell heavily on Friday night, down -0.7%. So we do seem to be in for some short-term moves to the down-side. 

The market does have a bullish bias with the 50-Day MA above the 200-Day MA – that suggests that any dip is likely to be bought.

IOZ Resitance and Support.

IOZ is a tracking ETF for the XJO.

I’ve marked Resistance and Support on the Chart. If the market fails at overhead resistance, then two obvious support levels exist on the IOZ chart, at 30.15 and 29.42. IOZ closed at 30.92 on Friday. First Support level is -2.65% lower. Second Support level is -4.85% lower. First Support level more or less coincides with an import oblique level on the Andrew’s Pitchfork. That would appear to be the most likely support level, i.e., 30.15. That’s about 7510 on the XJO.

SP500

The American market had a hiccough on Wednesday (echoed in the ASX on Thursday) after Powell indicated no rate cut in March. But – America is in the grip of reporting season and it surged on Thursday and Friday. Friday’s rise was largely the result of a big surprise from Meta (one of the Magnificent Seven Tech stocks) when it put on 20% in one day. WOW!

Amazon, another of the Magnificent 7, also had a great day on Friday. But it was up only (ONLY!) +7.87%. Amazon had reported on Thursday when it was up +2.63% – but that was at the lower end of a Daily Range of 12.2%. No doubt the impetus from Meta on Friday spilled over to Amazon. Friday’s high was still lower than Thursday’s high. Weird volatility.

Amongst other Magnificent 7 Stocks, Apple also reported on Thursday. It also had a volatile day with a Daily range of 7.03%, but it finished down on Friday -0.54%, but above its opening price and bouncing off its 50-Day MA. It is currently at the low end of a sideways channel.

Only one of the Magnificent Seven hasn’t reported so far – Nvidia, but it doesn’t report till near the end of February.

While all eyes have been on the Magnificent Seven – pushing the U.S. market higher, breadth in the U.S. has been abyssmal. For more on this, read Arthur Hill’s commentary. When breadth is poor, a market is being driven up by a few stocks so any shock could unsettle the market very easily.

Two Dow Components, McDonald’s and Caterpillar, report on Monday.

What’s been happening this week and this month in the Australian Sectors.

  1. Sector Changes this Week

All Sectors were up this week, with the relative weakest, XMJ (Materials) up +0.19%.

Best three were XEJ(Energy) +3.8%, XPJ (Property) +3.62% and IT (XIJ) up +2.97%.

Gold Miners, an industry subsection of Materials, also saw a return to form, up +3.62%.

  2. Sector Changes this month.

Comparing the Weekly Change with the 4-Weekly Change, we can see XEJ (Energy) has been strong on a weekly and monthly basis. XPJ and XIJ have surged in the past week compared to early in the month.

Those three sectors look the most likely improvers in the next month.

Long-Term Trend.

Cumulative New Highs minus New Lows provides a handy guide to the long term trend for long term investors. It is currently headed up and above its 10-Day MA – bullish. Stay with the trend.

Seasonality.

In February, overn the past seven years, XJO has been up four years and down three years. The worst was 2020 when Covid hit and XJO fell -8.21%. The best was 2019 when XJO rose in February +5.19%. Those figures don’t reveal much about what might happen.

The median figure for February during the past seven years was a rise of 1% in 2021.

February, 2023 was down -2.92%. So, maybe we’ll be up this February?

I think looking at February in the past seven years of XJO (IOZ) tells us little about what might happen in February this year than those historical notes. Our best bet is to watch the current charts.

Market Breadth.

The following chart shows the XJO to an Equal Weight Chart. The XJO is a Capital Weighted Chart which means the biggest stocks have more weight in the chart than smaller stocks. In an Equal Weighted Chart all stocks are given an equal weight. This provides an insight into market breadth. If the Equal Weighted Chart doesn’t keep pace with the Capital Weighted Chart, then a few big stocks are pushing up the XJO while smaller stocks may be languishing.

XJO (Cap weighted) is shown with blue and grey candles, MVW (Equal weighted) is shown with blue and yellow candles.

MVW was fairly closely matech to XJO from September to December, but then started to lose ground.

While XJO is now at a new high, MVW is now at a much lower level than it was in late December. Much of that is attributable to outperformance in Financials, especially the banks. If the big banks start to take a step backwards, our market is likely to go down as well. But – hasn’t that always been the way – our stock market is overweighted to banks – and the big miners – they are the controlling factors.

Conclusion.

The Australian market has had a good January, and the past two weeks have been excellent, up 3.8%. It might be time for a reality check. Market breadth is weakening, the market is overbought and negative divergences are showing on indicators.. A bit of a pull-back could be healthy for the market. Watch for support at 7510 on the XJO.

Good luck.