XJO up today +0.99% to finish at 7896.9. Next stop? 8000?
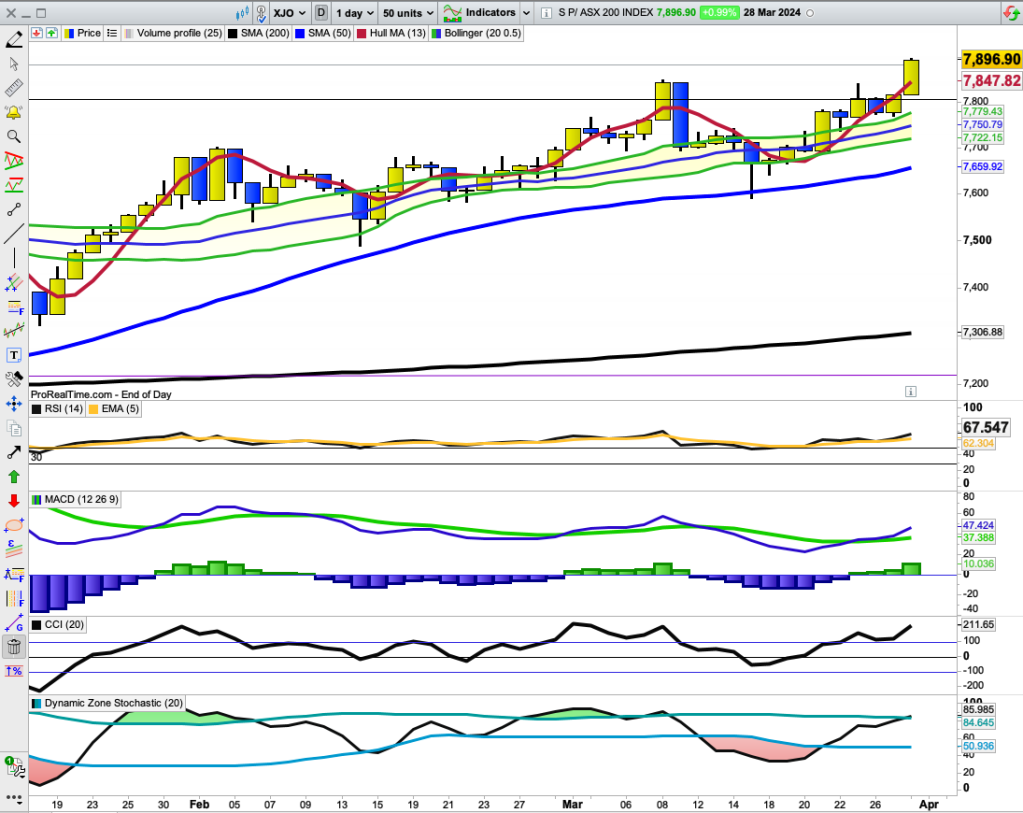
XJO is still not overbought with an RSI(14) at 67.55. The overbought level kicks in at 70. The last time we saw an RSI above 70, the XJO fell -1.82% the next day.
What’s more important is the 40 line on the RSI. Start to worry when RSI falls below 40. The last time we saw that was back in early November, 2023. That’s about five months ago. Since then, the XJO has rallied about 17%.
All sectors were up today led by Materials +1.08%. Financials was weakest (relatively) up +0.38%.
I think we are starting to see rotation going in the market with weaker areas becoming stronger and the previous strongest becoming (relatively) weaker.
That appears to be evident today. Materials has been relatively weak for many weeks, while Financials was relatively strong.
Here’s the chart for Financials. The panel to look at is the bottom pane.
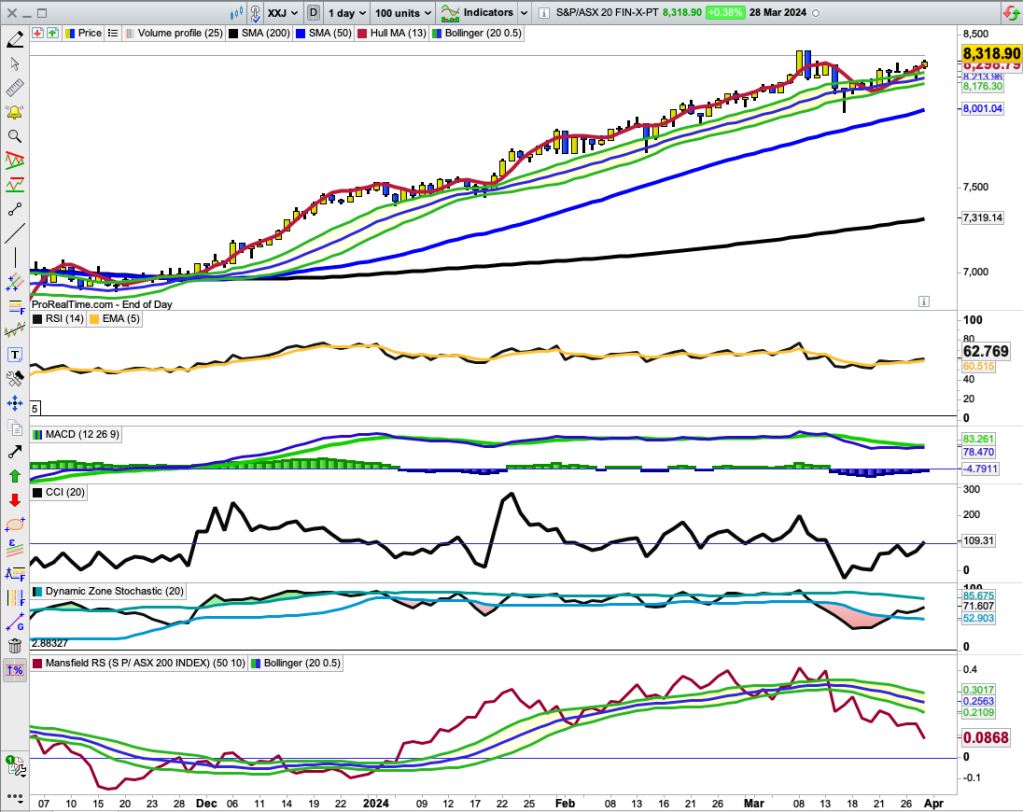
The bottom panel compares the XXJ to the XJO. It is currently trending down, i.e., it is doing worse than the xjo.
Here’s the chart for Materials. Again the panel to look at is the bottom panel.

The bottom panel is trending up, i.e., XMJ is doing better than the XJO. And that means that the XMJ is doing much better than Financials. Time to change allocations?
Have a great Easter.
